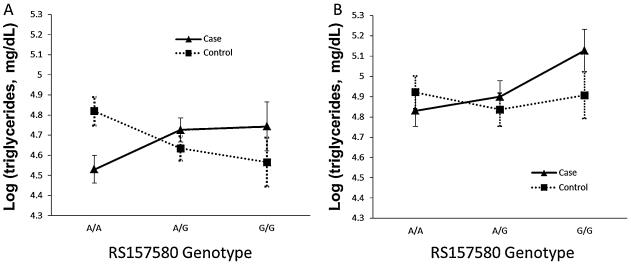
Figure 1. Predicted log(triglycerides) in relation to rs157580 genotypes by stress group.
Predicted log(triglyceride) with 95% confidence intervals in relation to rs157580 genotypes by stress group (cases vs. controls) adjusted for age, gender (U.S. samples) and medication use with an additive model: A) in U.S. sample, rs157580 × Stress group interaction p = 0.004; and B) in Danish sample, rs157580 × Stress group interaction p = 0.075.

