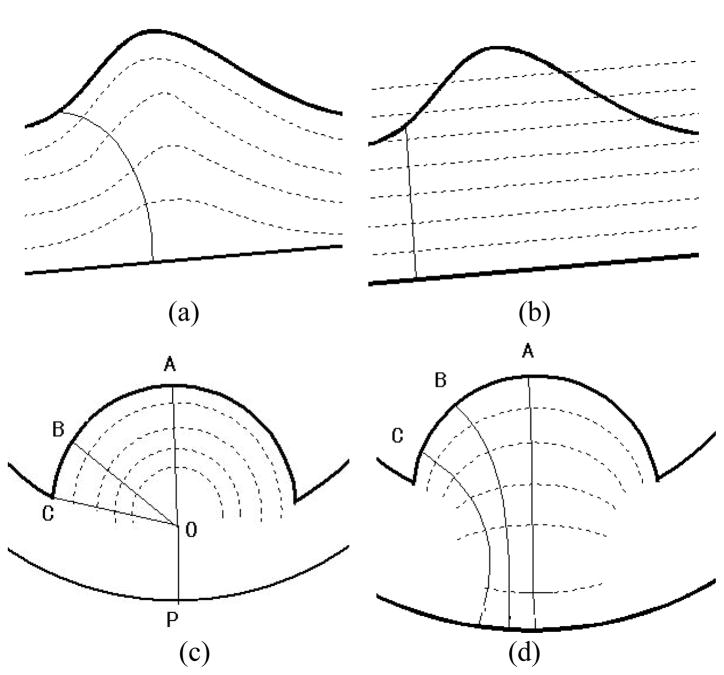
Fig. 1.
The thick curves represent the ideal inner and the outer borders. The dashed curves represent the iso-distance surfaces computed by the DT-based method between the two ideal borders. The thin curves indicate the paths from one border to the other. (a) It shows a path traced in the DT field built based on the inner border (higher curve). (b) It shows the same local shape of the bladder walls, but the DT field is built based on the outer border (lower curve). The path traced here differs from that in (a). (c) The “tumor” has a hemisphere shape. By the DT-based method, the thicknesses at A, B, C are calculated as along respectively, which are the same and do not reflect the true thickness changes. (d) The paths starting from A, B, C are computed by the electric-field line tracing method and have different lengths, i.e., the paths in (d) are more sensitive than that in (c) and more reasonable.

