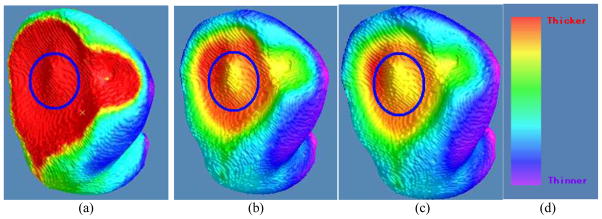
Fig. 11.

Thickness mappings on the 3D patient bladder, where the colors are superimposed on the inner surface mesh, by the three methods of (a) the previous DT-based method [17], (b) the presented DT-based method in Section 2.2, and (c) the presented EFLT method in Section 2.3. Note that the circled parts on the three pictures demonstrate that (b) and (c) have a much higher sensitivity to show the variation of the thickness around the tumor than (a), and furthermore (c) is some more sensitive than (b). (d) The same color bar as used in Fig. 10.
