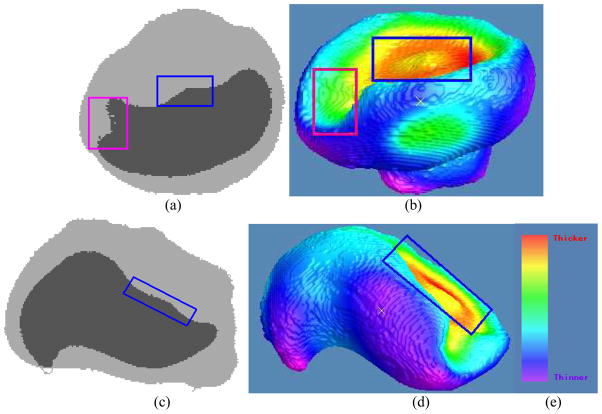
Fig. 12.
Demonstration of the consistency between the original segmented data and the visualization of the thickness mapping in Fig. 11. Picture (a) shows a section of an image slice along the X-Z plane. The boundary of the darker part is the bladder wall inner border. Picture (b) is the generated 3D view of the bladder wall inner border as shown in the pose corresponding to (a). Note that the regions marked by blue rectangles on both (a) and (b) indicate the same region as shown in Fig. 11(b). They together demonstrate the consistency: a small bump in a large basin. This consistency can also be observed by the region marked by the pink rectangles in both (a) and (b). By rotating the image volumes to another orientation for an image slice of (c) along the Y-Z plane, the generated 3D view of the bladder wall inner border is then shown by (d) in the pose corresponding to (c). The regions marked by blue rectangles in (c) and (d) indicate the same region as the one marked in (a), (b) and Fig. 11(b). This further demonstrates the consistency among them. (e) is the color bar same as used in Fig. 10 and 11.

