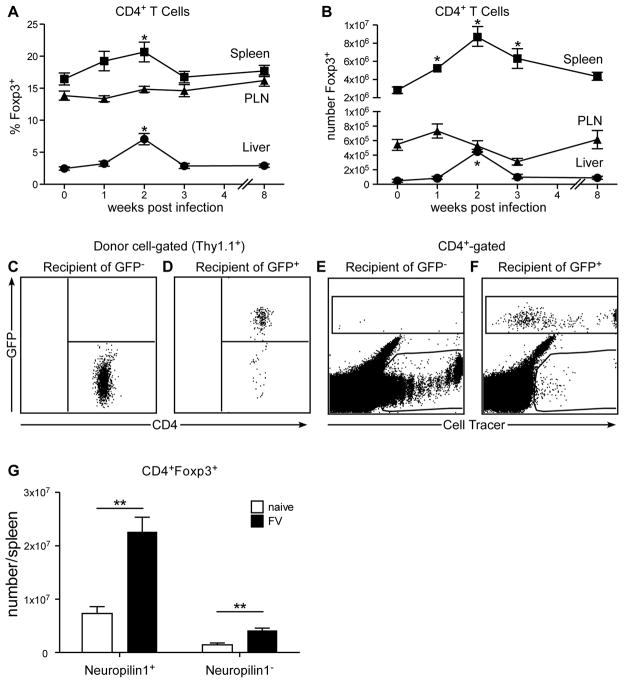
Figure 1. FV infection induces expansion of natural Tregs.
Kinetics of the change in A) percent and B) absolute number of CD4+ T cells expressing Foxp3+ cells in the spleen (squares), peripheral lymph nodes (PLN) (triangles) and liver (circles) following FV infection. Bars represent the mean and standard error of the mean (SEM) of 13–17 mice from 7 independent experiments per time point. The statistically significant increases from naïve to post-FV infection in the spleen and liver are indicated (*) (One-Way ANOVA w/Dunnett’s multiple comparisons post-test). Mice received an adoptive transfer of FACS sorted C) Thy1.1+ CD4+ GFP− or D) Thy1.1+ CD4+ GFP+ cells from naïve Foxp3GFP reporter mice and recipients were infected with FV. At 14 dpi the spleens of recipient mice were analyzed by flow cytometry for GFP expression in Thy1.1+ donor cells. Dot plots are representative of 3 independent experiments. In a similar experiment, mice were infected with FV and given CellTrace™ violet-labeled E) CD4+ GFP− or F) CD4+ GFP+ cells from naïve CD4.TCR Tg.Foxp3GFP reporter mice. At 7 dpi the spleens were analyzed by flow cytometry for GFP and CellTrace™ violet expression. At 2wpi, splenic Tregs were analyzed for expression of G) surface Neuropilin 1 and absolute numbers of each subset were calculated on a per spleen basis. Differences between naïve and infected were statistically different: 320% increase for Nrp1+ Tregs, P = .0064 (unpaired t test).

