
Figure 2.
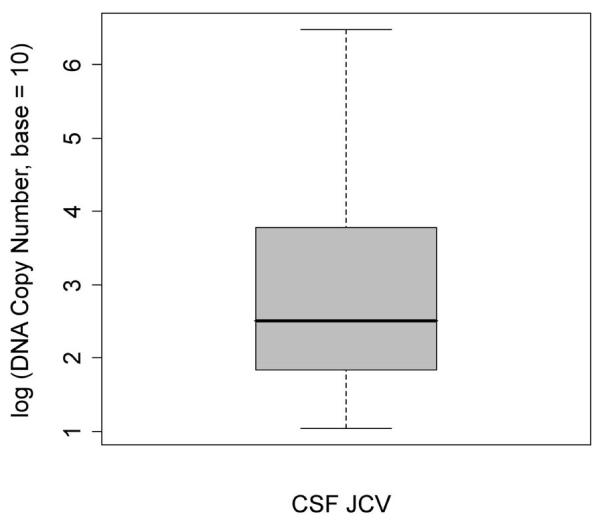
Box plot of the distribution of viral copy number in 35 CSF samples taken at or near the time of PML diagnosis: median = 2.508; 25th percentile = 1.794, 75th percentile = 3.866, minimum value = 1.041, maximum value = 6.477. The data are normally distributed about the mean (p-value=0.3137).