Figure 7. .
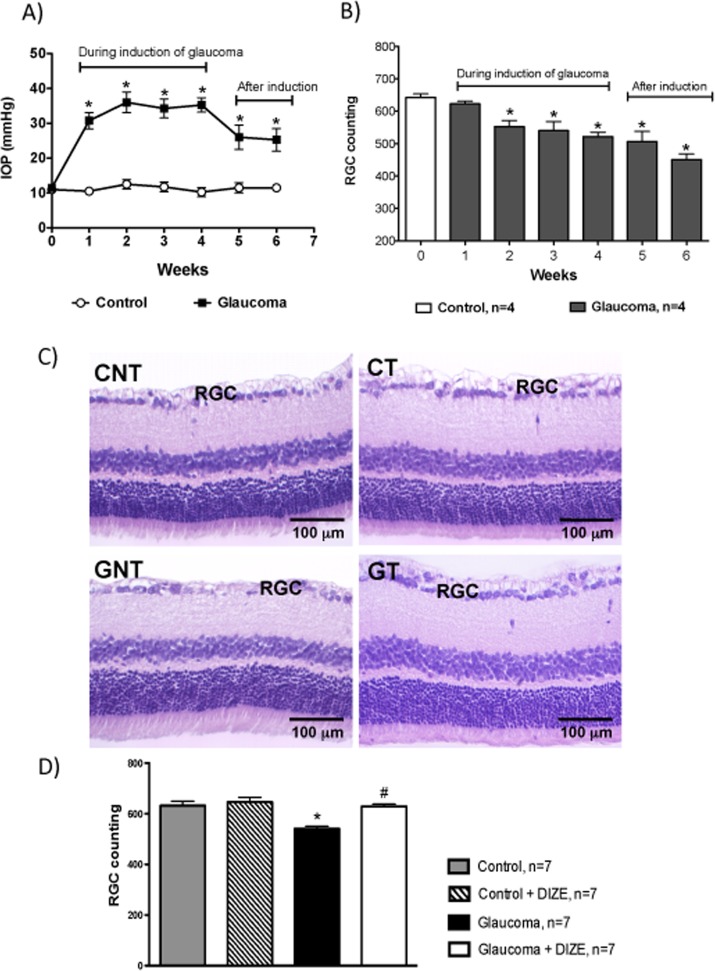
Histologic analysis of RGCs. (A) IOP during the 4 weeks of the induction of glaucoma followed by two additional weeks without induction. *P < 0.05 versus control. (B) Number of RGCs during the 4 weeks of the induction of glaucoma followed by two additional weeks without induction. *P < 0.05 versus control. (C) Representative photomicrographs of retinas showing the lower number of RGCs in untreated glaucomatous rats and the beneficial effect of DIZE on this parameter. (D) Quantification of RGCs in the retinas of rats. *P < 0.001 versus control and #P < 0.001 versus glaucoma. One-way ANOVA followed by the Newman-Keuls posttest.

