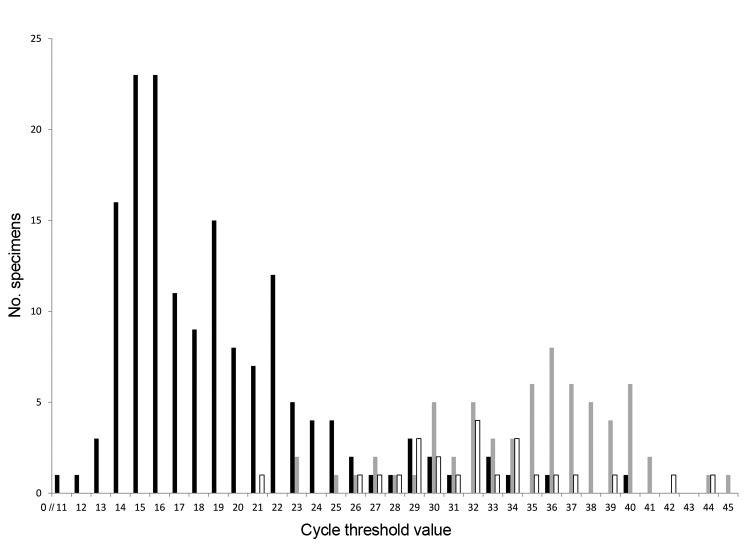
Figure 2.
Frequency distribution of Ct values for specimens in which rotavirus was detected by qRT-PCR, 3 New Vaccine Surveillance Network sites (USA), October 2008–October 2009. For 1 (1%) acute gastroenteritis EIA+ specimen, 425 (87%) acute gastroenteritis EIA− specimens, and 476 (95%) healthy control specimens, no virus was detected by qRT-PCR. Ct, cycle threshold; qRT-PCR, semiquantitative reverse transcription PCR; EIA, enzyme immunoassay; +, positive; −, negative. Black bars indicate acute gastroenteritis patients with EIA+ specimens, n = 157; gray bars indicate acute gastroenteritis patients with EIA− specimens, n = 65; white bars indicate healthy controls, n = 24.

