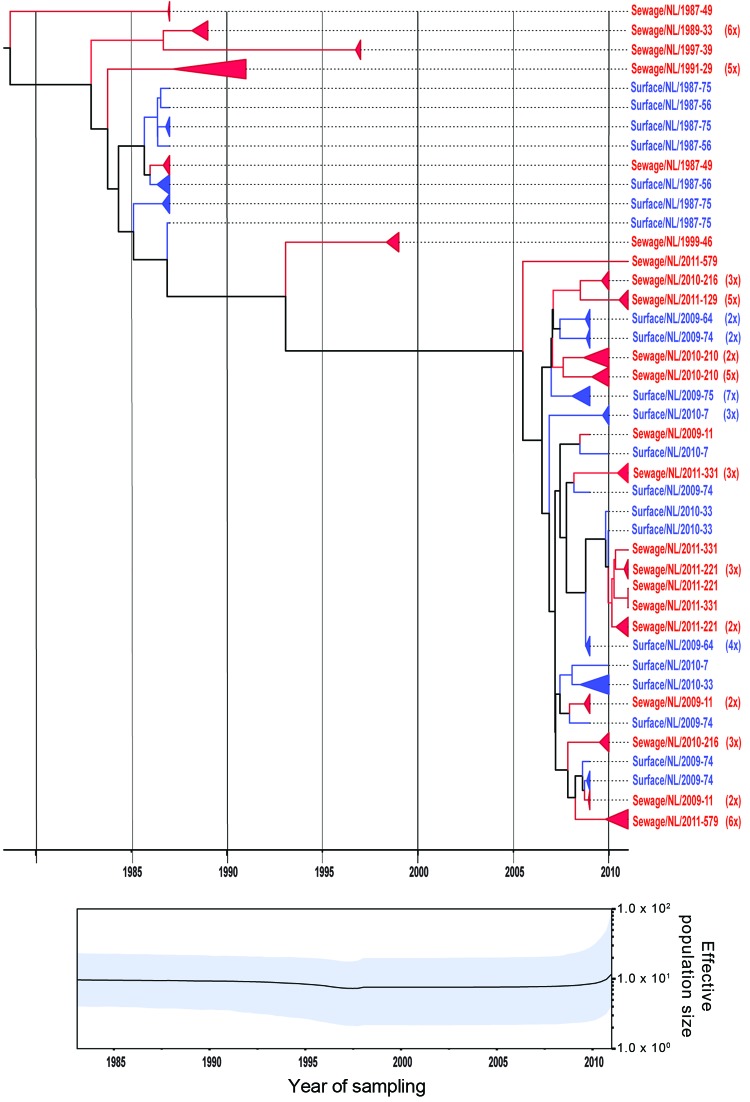
Figure 3.
Phylogenetic relationships and genetic diversity over time for 166 sequences of Aichi virus genotype B strains collected in the Netherlands. A) Maximum-clade credibility tree was generated by the Bayesian Markov chain Monte Carlo method in BEAST (28), based on a multiple alignment of nucleotide sequences (481-nt) of the viral protein 1 region. The tree is rooted to the most recent common ancestor, visualized in FigTree (http://tree.bio.ed.ac.uk/software/figtree/), and plotted on a temporal y-axis scale using the sampling dates. Aichi virus strains from the Netherlands isolated from sewage (red) and surface waters (blue) are indicated. Clusters of sequences of the same sample are represented by triangles (a collapsed branch), and the number of isolates in each triangle is shown in parentheses. B) Bayesian skyline plot obtained by analyzing different Aichi virus sequences sampled at different times. The results are a relative measure for genetic diversity through time. The line represents the median, and the shaded area represents the 95% highest posterior density of the number of isolates.

