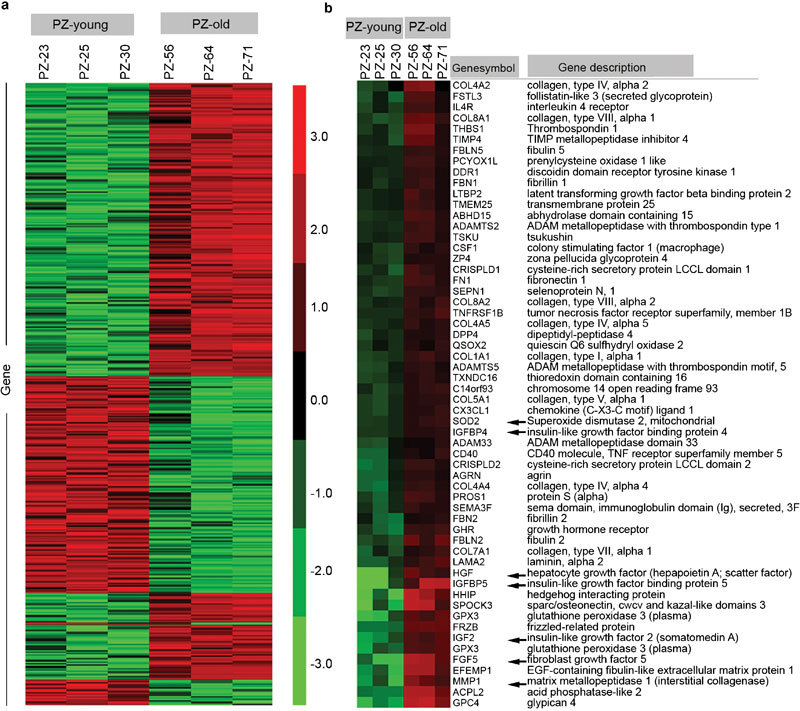
Figure 6.

Hierarchical clustering analysis of differentially expressed genes in prostatic stromal cells from PZ-young and PZ-old donors. (a) Heatmap of all the differentially expressed genes classified based on fold change cutoff of ≥2 or ≤0.5. The relevant genes are grouped by hierarchical clustering analysis. Samples from two groups of PZ-young and PZ-old, each group including three separate individuals, are displayed in columns, and genes are displayed in rows. Most of the up- or down-regulated genes in PZ-old cells show opposite patterns in PZ-young cells, and there is good uniformity among the three different individuals in each group. (b) Heatmap of 59 genes encoding extracellular paracrine mediators that showed significant expression changes; these genes exhibit average fold changes of ≥2 in the PZ-old group versus the PZ-young group. Arrows represent transcript alterations verified by Q-PCR. Gene expression is represented as a colour; the intensity of the colour correlates with fold change, with brighter red for higher values and brighter green for lower values, as shown in the colour bar in the middle. PZ, peripheral zone; Q-PCR, quantitative PCR.
