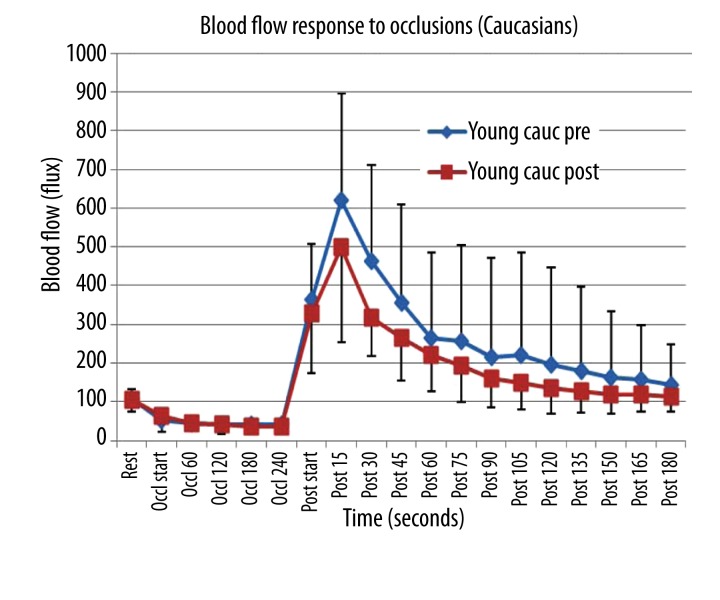
Figure 2.
Illustrated here is the skin blood flow as the mean of 10 subjects plus or minus the standard deviation measured at rest and during and after 4 minutes of vascular occlusion. Data is shown before (pre) and 3 weeks after (post) administration of vitamin D in 10 Caucasian subjects. The x axis shows the resting blood flow, blood flow during occlusion and for 180 seconds post occlusion.

