
Figure 4.
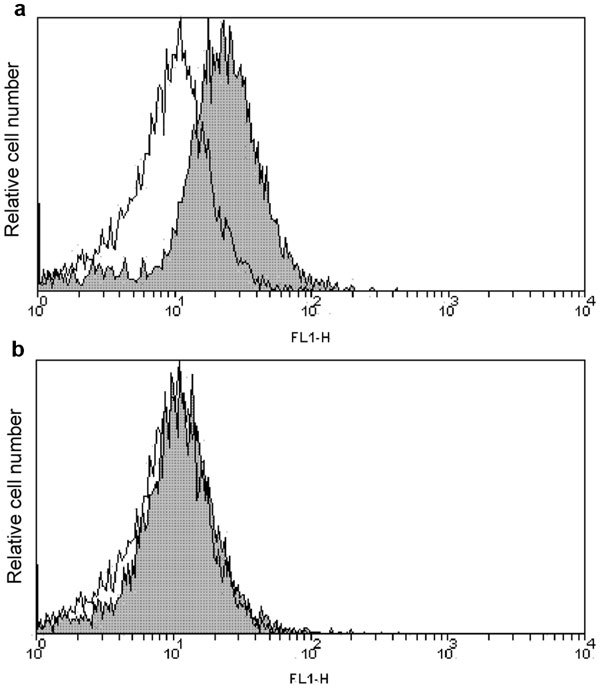
Flow cytometric analysis of H2O2 internalisation across the sperm membrane. The shaded histograms show the fluorescence intensity after the exogenous addition of H2O2 in the absence (a) or presence (b) of the ganglioside GT1b. The open histograms show the DCFH fluorescence of cells pre-incubated with GT1b only. A representative result of six separate experiments. PI-labelled dead cells were excluded from the analysis.