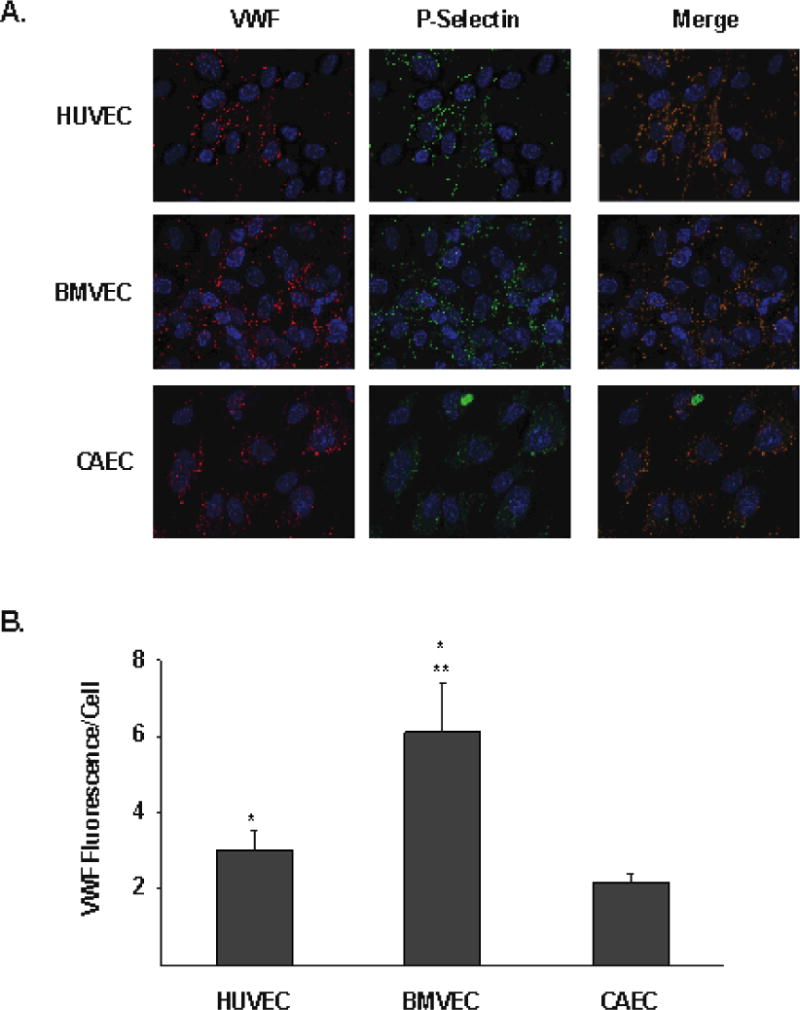
Figure 3. HUVEC, BMVEC, and CAEC VWF and P-selectin content.

A) Cultured endothelial cells were fixed and permeabilized. VWF (red) and P-Selectin (green) was then assessed by immunofluorescence. Cell nuclei were stained with DAPI (blue). The merged image shows colocalization of VWF and P-Selectin in each cell type. B) VWF immunflourescence per DAPI-positive cell was calculated and is shown for each indicated endothelial cell type (arbitrary units). The results are expressed as means +/− SEM. * Tukey’s HSD test, as compared to CAEC (p = 0.0002). ** Tukey’s HSD test, as compared to HUVEC (p < 0.0001).
