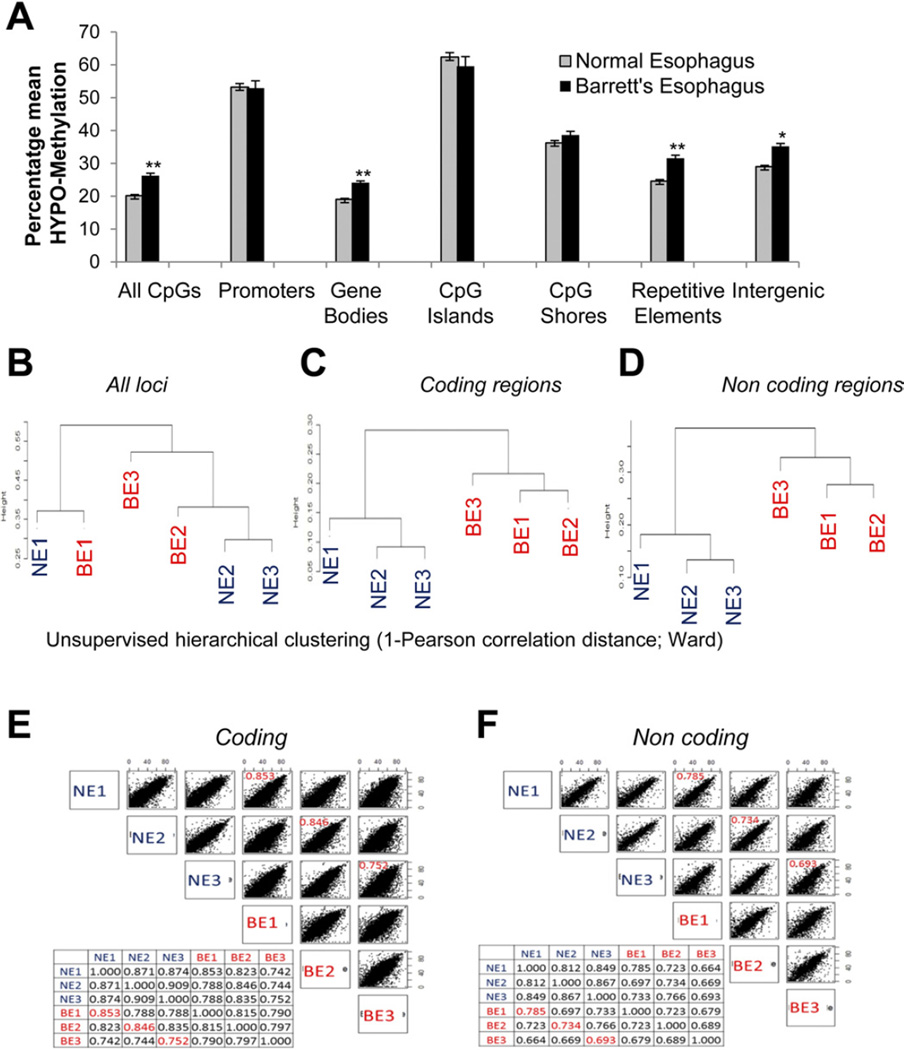
Figure 1.
Genome-wide hypomethylation in BE. (A) Three sets of endoscopic biopsy specimens representing NE and BE were examined using HELP tagging. Hypomethylation was seen in BE (t test, **P< .005; *P< .05). Hierarchical clustering was based on CpG methylation for all (B) probes, (C) coding regions, and (D) noncoding regions. Correlation plots were created based on methylation of (E) coding and (F) noncoding regions.

