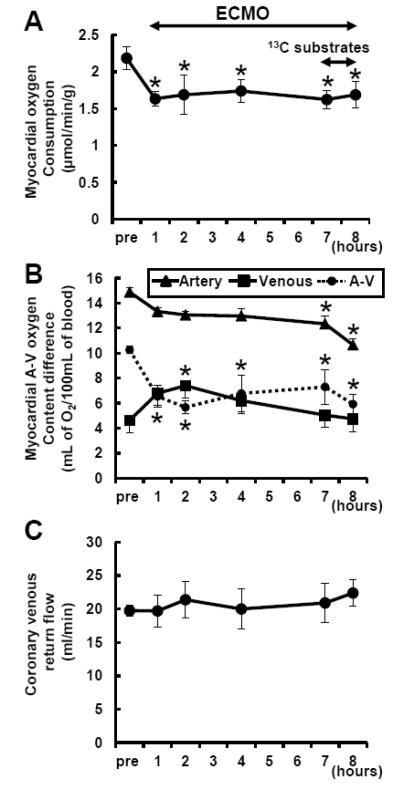
Figure 2. Myocardial oxygen consumption rate (MVO2) during ECMO.
MVO2 (A) was determined through arteriovenous oxygen content difference (B) and coronary sinus return flow (C). MVO2 was significantly decreased with ventricular unloading. Substrate infusion itself did not lead to change MVO2. Coronary venous oxygen content was increased after starting ECMO, and then it was gradually decreased parallel to coronary arterial oxygen content during ECMO. Thus difference between arterial and venous oxygen content was significantly decreased during ECMO, whereas coronary flow was not changed. A-V, arteriovenous oxygen content difference (circle with dotted line). Values are means ± SE; n = 10. *: P < 0.05 vs pre (baseline prior to ECMO).

