
Figure 5. Energy metabolite ratios by 1H-NMR spectra from left ventricular tissues at the end of the protocol.
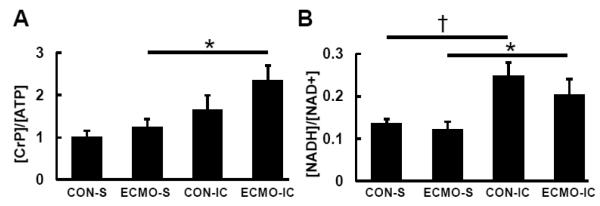
Values are means ± SE; n = 5-6 per group. *: P < 0.05, †: P < 0.01 vs systemic infusion (S).
Official websites use .gov
A
.gov website belongs to an official
government organization in the United States.
Secure .gov websites use HTTPS
A lock (
) or https:// means you've safely
connected to the .gov website. Share sensitive
information only on official, secure websites.
Values are means ± SE; n = 5-6 per group. *: P < 0.05, †: P < 0.01 vs systemic infusion (S).