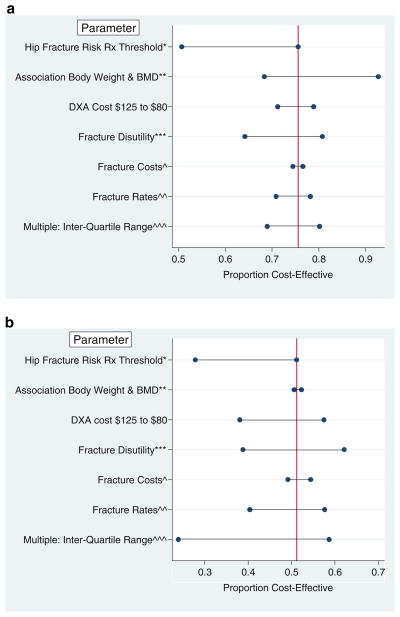
Fig. 3.
Sensitivity analyses: effect of parameter changes on proportions of women (a) and men (b) aged 65 without prior fracture for whom bone densitometry is cost-effective. *Ten-year hip fracture risk treatment threshold varied from 6 to 3%; **Odds ratio of femoral neck osteoporosis per 10kg increase body weight varied from 0.22 to 0.65; ***Fracture disutility varied from 50 to 150% of base case value; ^Fracture costs varied from 70 to 130% of base case value; ^^Fracture rates varied from 80 to 120% of base case value; ^^^From probabilistic sensitivity analyses (see “Appendix”). Vertical line represents base vase proportion for whom bone densitometry is cost-effective

