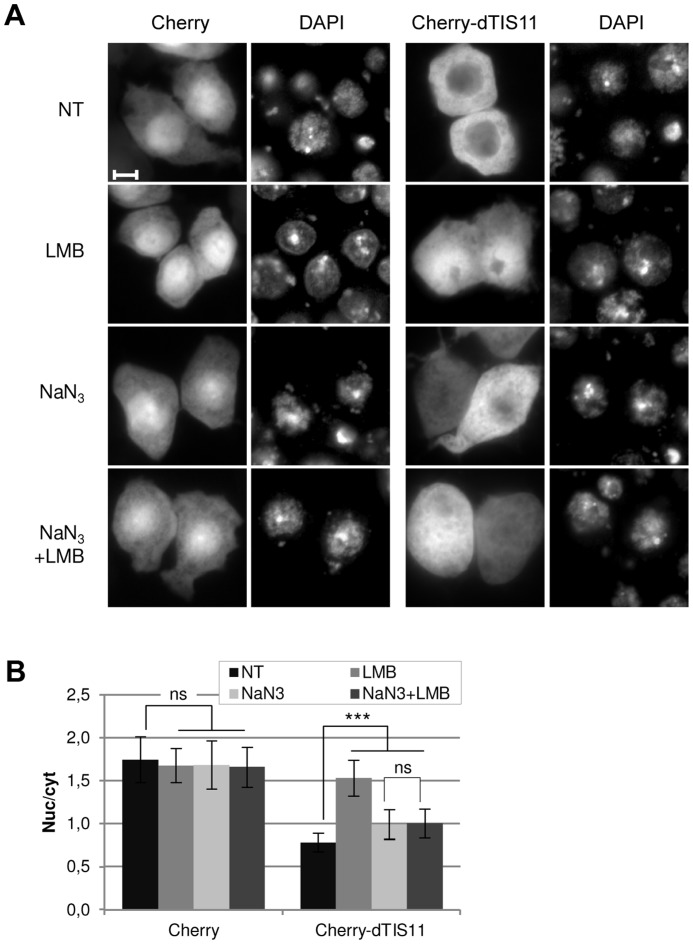
Figure 3. dTIS11 nuclear accumulation relies on an active energy-dependent mechanism.
(A) Subcellular distribution of Cherry and Cherry-dTIS11 proteins upon energy depletion by sodium azide (10 mM, 2h) in the presence or the absence of leptomycin B (10 ng/ml). Bar = 5 µm. (B) Quantification and statistical significance of the data shown in (A). The analysis was performed as in Fig.2 for 30–40 cells per condition. Bars show the average of the nuc/cyt ratio ± s.d. ***: p<0.0001; ns: non-significant (p>0.05) (U-tests). The results are representative of two independent experiments.

