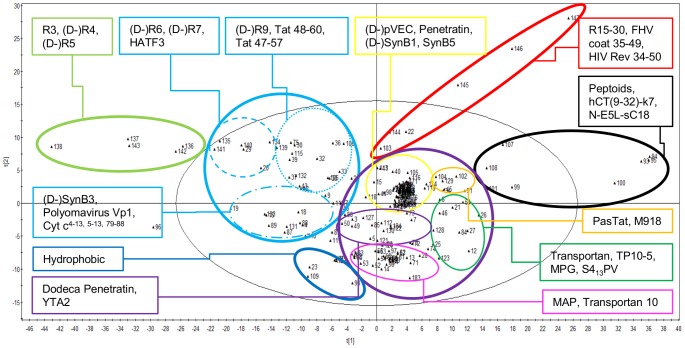
Figure 2. Score plot of the first versus the second principal component of the PCA-analysis of 186 peptides.
The six main clusters of peptides are indicated by a bold line (light green, light blue, red, purple, black and dark blue clusters), while the eight subclusters are encircled by a thin line (light blue dashed and/or dotted line, yellow, orange, dark green, purple and pink clusters). For each cluster, some examples of peptides are indicated.

