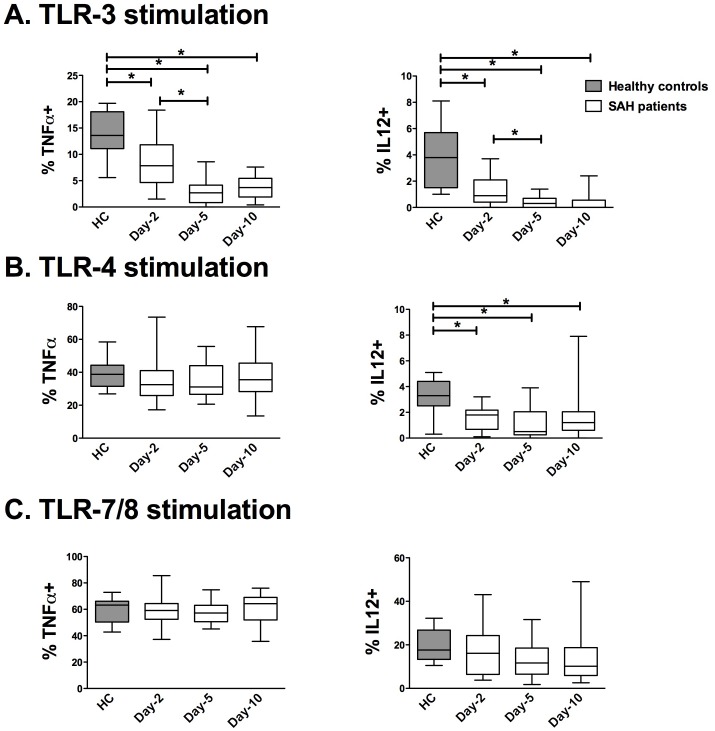
Figure 4. Time course of TLR-induced production of TNF-α and IL-12 in circulating mDCs from patients with aneurysmal subarachnoid hemorrhage.
Intracellular cytokine measurement was performed in circulating mDCs from SAH patients (N = 21) on days 2, 5 and 10 and from HC (N = 11). The percentages of mDCs expressing TNF-α or IL-12 were assessed after a 3.5-hour ex vivo stimulation with (A) polyIC (TLR-3 agonist), (B) lipopolysaccharide (TLR-4 agonist) or (C) CL097 (TLR-7/8 agonist). The percentage of positive DCs without TLR-stimulation was below 1% (data not shown). The results are presented as percentages of mDCs expressing TNF-α (%TNF-α+) or IL-12 (% IL-12+). Plots represent median (Interquartile ranges). HC: healthy controls. mDCs: myeloid dendritic cells. SAH: aneurysmal subarachnoid hemorrhage. TNF-α: tumour necrosis factor -α. IL-12: intreleukin-12. * P<0.05.

