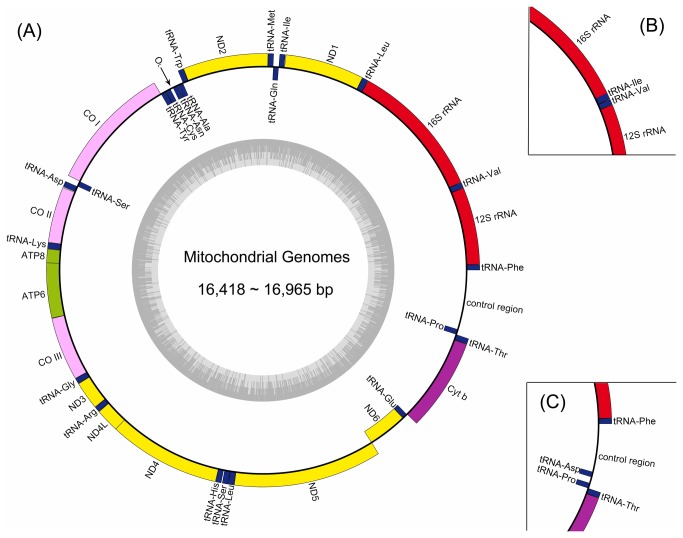
Figure 1. Gene maps for mitochondrial genomes.
Genes encoded on the heavy and light strand are shown outside and inside the circle, respectively. The inner grey ring indicates the GC content. This genome map was constructed via OrganellarGenomeDRAW [81] with manual modifications. (A) The mt gemone organization of Aethaloperca rogaa, Anyperodon leucogrammicus, Cephalopholis sonnerati, Cromileptes altivelis, Epinephelus akaara, E. areolatus, E. awoara, E. bruneus, E. coioides, E. epistictus, E. fuscoguttatus, E. lanceolatus, E. moara, E. trimaculatus, Hyporthodus octofasciatus, H. septemfasciatus, Plectropomus areolatus, P. leopardus, and Triso dermopterus. (B) The mt gemone organization of genera Variola, V. albimarginata and V. louti. (C) The mt gemone organization of Cephalopholis argus.

