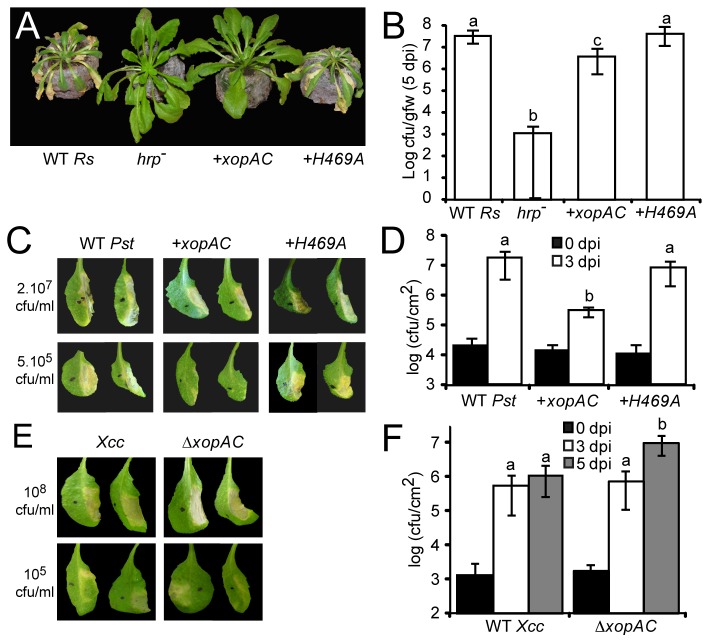
Figure 2. xopAC can confer avirulence to Pst strain DC3000 and Rs strain GMI100 on Arabidopsis ecotype Col-0.
Four-week-old Col-0 plants were inoculated. (A, B) Wild-type and hrcV (hrp -) mutant of Rs GMI1000 or strain derivatives carrying xopAC (+xopAC) or xopAC-H469A (+H469A) were inoculated by root dipping. (A) Pictures were taken at 11 days post-inoculation. (B) Bacterial populations in the aerial parts of the plants were determined at 5 dpi and expressed as log of colony-forming units per gram of fresh weight (cfu/gfw). For each strain, three samples of three plants each were analysed. Two independent experiments were performed. Statistical groups were determined using a Wilcoxon test (P<0.003) and indicated by different letters. (C, D) Leaves were infiltrated with wild-type Pst DC3000 or derivatives carrying pEDV6-xopAC (+xopAC) or pEDV6-xopAC-H469A (+H469A). (C) Bacterial suspensions of Pst at 2x10⁷ cfu/ml or 5x10⁵ cfu/ml were used and pictures were taken 3 days post-inoculation. (D) Bacterial suspensions at 5x10⁵ cfu/ml were infiltrated in leaves. In planta bacterial populations in the inoculated areas were determined 0 and 3 days post-inoculation and expressed as log (cfu/cm2). Standard deviations were calculated on two independent experiments with three samples of two leaf discs from different plants for each strain. Statistical groups were determined using a Wilcoxon test (P<0.012) and indicated by different letters. (E, F) Leaves were inoculated by hand infiltration with wild-type Xcc strain 8004 and 8004∆xopAC. (E) Bacterial suspensions of Xcc at 108 cfu/ml or 105 cfu/ml were used and pictures were taken 4 days post-inoculation. (F) Xcc strains were infiltrated at a bacterial density of 105 cfu/ml. In planta bacterial populations in the inoculated areas were determined 0, 3 and 5 days post-inoculation and expressed as log (cfu/cm2). One representative experiment out of three is shown. Standard deviations were calculated on at least 4 biological samples. For each experiment, three samples of two leaf discs from different plants were collected for each strain. Statistical groups were determined using a Wilcoxon test (P<0.021) and indicated by different letters.

