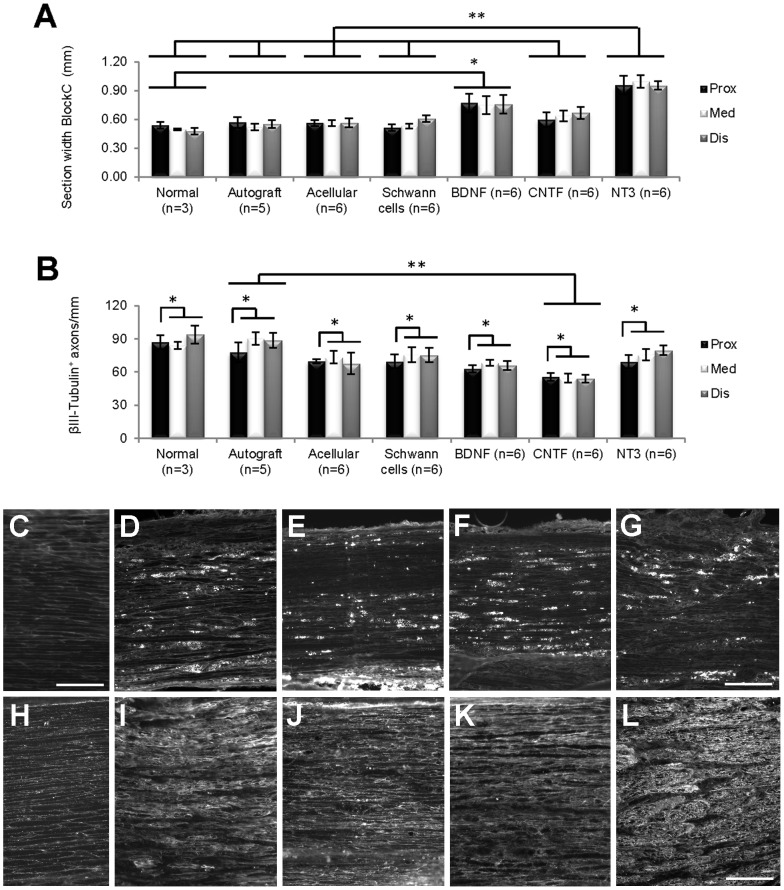
Figure 4. Analysis of longitudinal graft sections.
(A) Within the grafts themselves (Block C), longitudinal sections of BDNF grafts were significantly wider (*) than normal nerves, and sections of NT3 grafts were significantly wider (**) than those of normal nerves, autograft, acellular, SCs and CNTF grafts. (B) Overall, the number of βIII-Tubulin+ axons/mm in longitudinal sections differed between the proximal and other counting distances (*), with sections of autografts containing significantly more axons (**) compared to CNTF grafts. Values represent M ± SEM; p<0.025 in A and p<0.05 in B. Further details on statistical analysis provided as Statistical Information S1. (C–G) ED1 immunostaining; C normal PN; D–G, acellular, BDNF, CNTF and NT3 grafts respectively. (H–L) laminin immunostaining; F, normal PN; G–L, acellular, BDNF, CNTF and NT3 grafts respectively. Scale for D–G = 200 µm, for C, H–L = 100 µm.

