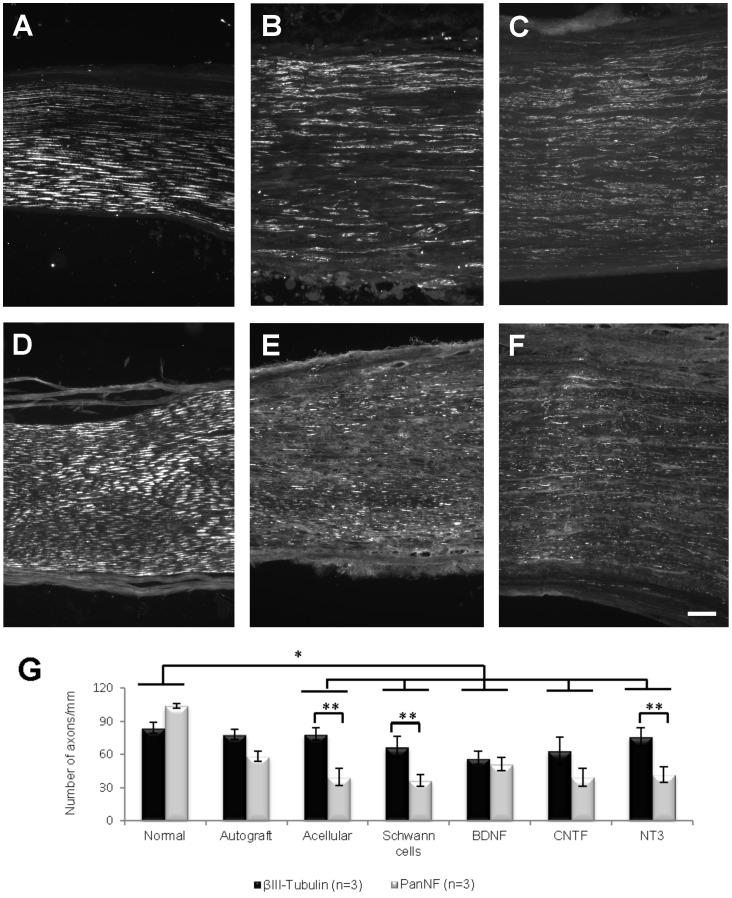
Figure 5. Representative examples of longitudinal sections of normal nerve (A and D), SCs (B and E) and NT3 (C and F) grafts immunostained with βIII-Tubulin (A–C) or PanNF (D–F).
Images are series of sections from the same nerve or graft. (G) The difference between βIII-Tubulin+ and PanNF+ axons/mm in the normal group was significantly different from that observed in all groups except the autograft group (*). The numbers of axons/mm identified by each axonal marker were significantly different (**) in the acellular, SCs and NT3 groups. Values represent M ± SEM and p<0.05. Further details on statistical analysis provided as Statistical Information S1. Scale bar for A–F: 100 µm.

