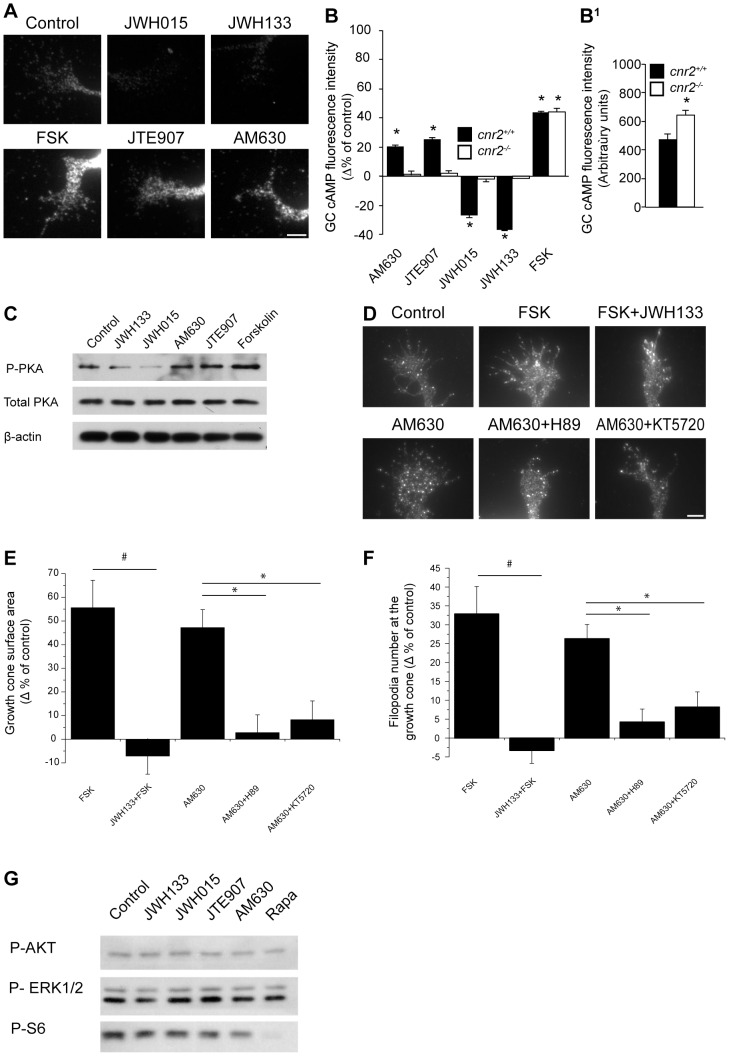
Figure 8. CB2R recruits the cAMP/PKA Pathway as a Downstream Effector.
Growth cones were immunolabeled for intracellular cAMP following FSK, CB2R agonist (JWH015, JWH133), or CB2R inverse agonist (AM630, JTE907) application. (A) Representative photomicrographs. Scale bar, 5 µm. (B) Quantification of cAMP fluorescence intensity at the cnr2+/+ growth cone indicates a significant decrease in cAMP levels following treatment with JWH133 and JWH015 while the opposite was observed following stimulation with AM630, JTE907 or FSK. No significative variations of cAMP were observed in growth cones obtained from cnr2−/− after pharmacological treatments (mean ± SEM; n = 152 to 223 per condition, *P<0.05 vs control). (B1) Under control conditions, cAMP levels in growth cones of cnr2−/− embryos were significantly higher than those observed in wildtype embryos (mean ± SEM; n = 152 to 175 per condition, *P<0.05 vs control). (C) Western blot analysis indicates important changes in PKA phosphorylation levels following stimulation with CB2R agonists or inverse agonists. (D) For growth cone morphology analysis, neurons were exposed for 1 hour to FSK, FSK and JWH133, AM630, AM630 and H89 (a PKA inhibitor), or AM630 and KT5720 (another PKA inhibitor). Scale bar: 5 µm. Neurons were fixed and immunolabeled for GAP-43. Histograms represent quantification of growth cone surface area (E) and filopodia number (F). JWH133 abolished FSK induced increases in growth cone surface area and filopodia number and PKA inhibition abolished growth cone morphology modifications induced by AM630 (mean ± SEM; n = from 160 to 360 per condition, # P<0.05 vs FSK group *P<0.05 vs AM630 group). (G) Effect of the addition of CB2R agonists or inverse agonists on phosphorylation levels of AKT, ERK½ and S6 (P-AKT, P-ERK1/2 and P-S6).

