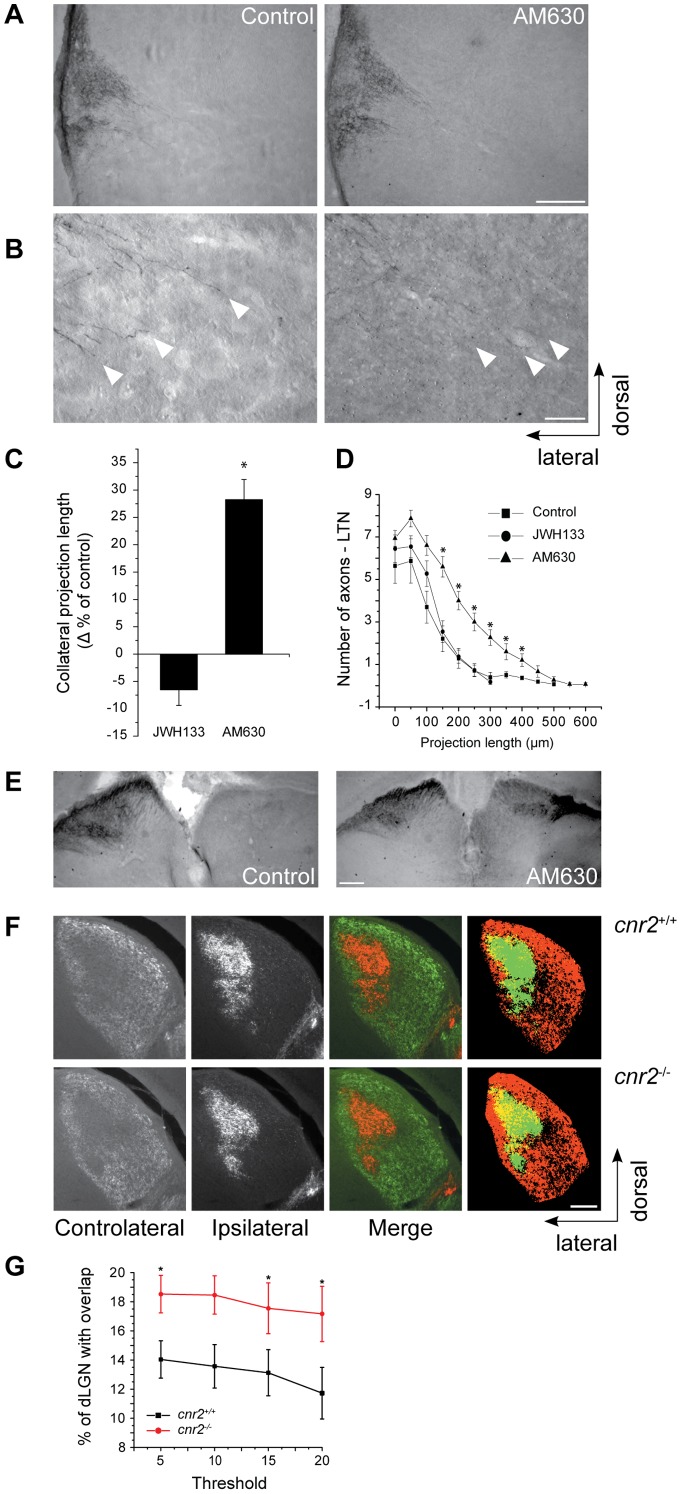
Figure 10. CB2R Modulates RGC Projection Development In Vivo and Eye-Specific Segregation in the Lateral Geniculate Nucleus.
Hamsters at P1 were injected in the eye with CTb-FITC and 300 µM AM630, 300 µM JWH133 or vehicle control. Perfusion and brain fixation were done at P5. CTb revelation was performed with anti-CTb, enhanced with ABC Kit and revealed with DAB-Nickel kit. Photomicrographs of the lateral terminal nucleus (LTN) for the control and the AM630 groups (A) and terminal magnifications are shown (B). Quantification for collateral projection length is expressed as mean ± SEM percentage versus the control group (C). Quantification for axon branch density was also performed. AM630 increased axon growth (C) and collateral branch number (D) (n = 4 to 5 brains per condition, *P<0.05 versus control group). (E) Photomicrographs showing SC for the control and the treated groups. In the AM630 treated group, the presence of aberrant projections is illustrated by labeling in both hemispheres. (F) Fluorescence images of the dLGN for cnr2 +/+ and cnr2 −/− mice showing contralateral projections from right eye injected with CTb-Alexa-546 and ipsilateral projections from left eye injected with CTb-Alexa-488. Merged images show all projections from both eyes to the dorsal lateral geniculate nucleus, overlaying projections are shown in yellow (F). (G) Graphic shows percentage of the dorsal lateral geniculate nucleus (dLGN) receiving overlapping inputs as mean ± SEM (n = 4 to 5 brains per condition, *P<0.05 versus control group). Quantification of the percentage of overlapping inputs in cnr2 −/− and cnr2 +/+ adult mice indicating a significant increase in overlap between contralateral and ipsilateral RGC projections in the dLGN of cnr2 −/− mice. Scale bars, 200 µm (A, F); 50 µm (B); 600 µm (E).

