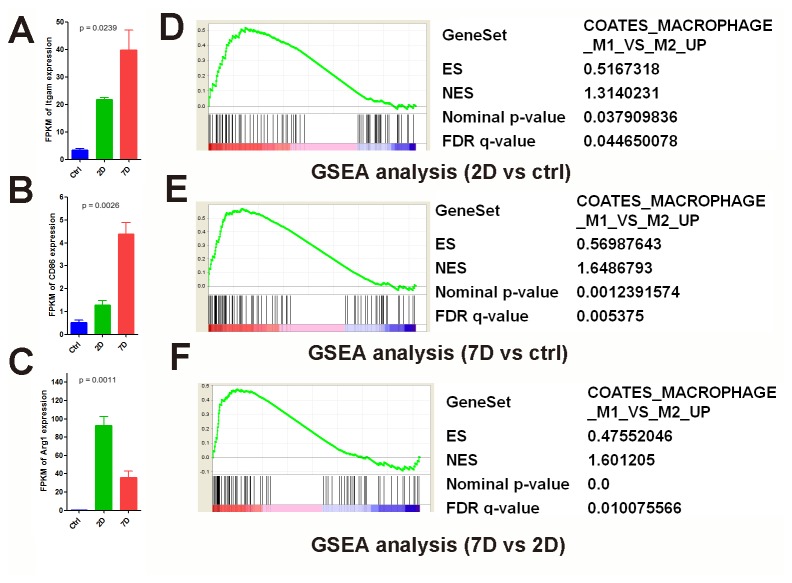
Figure 6. The expression of macrophage marker genes in both acute and subacute phases of SCI.
Expression profile of the common macrophage marker Itgam (A), M1 specific marker CD86 (B) and M2 specific marker Arg1(C) during the time-course of SCI. P values were calculated by one-way ANOVA. GSEA analysis: differential gene expression was ranked by fold change (x-axis: 2D vs control (D), 7D vs control (E), 7D vs 2D (F)). The most up-regulated genes are shown on the left side (red), while the most up-regulated genes were shown on the right side (blue). Black bars represent the positions of the M1 vs M2 up-regulated signature genes in the ranked list. Enrichment score (ES, Y-axis) reflects the degree the genes are overrepresented. When the distribution is at random, the enrichment score is zero. Enrichment of signature genes at the top of the ranked list results in a large positive deviation of the ES from zero. NES, normalized enrichment score; FDR, false discovery rate-adjusted q value.

