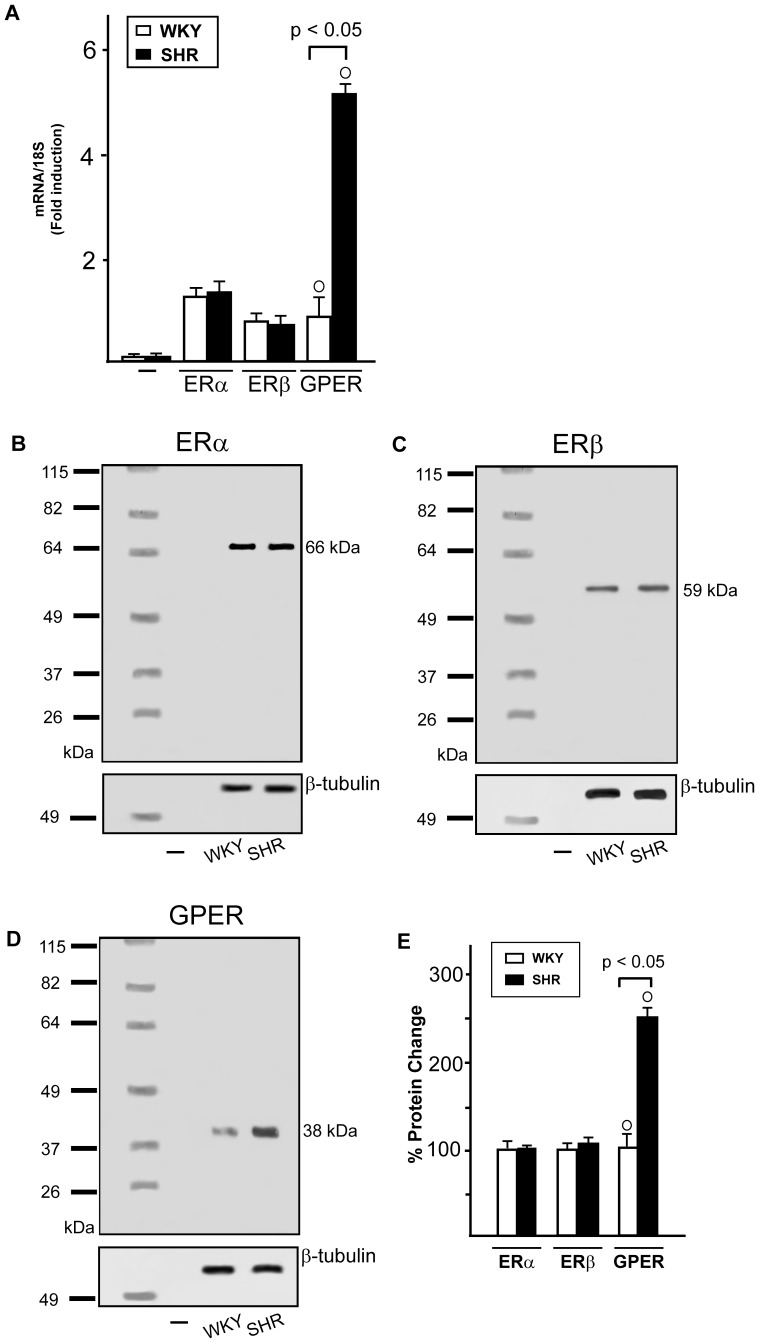
Figure 1. ERs expression in WKY and SHR left ventricular homogenates.
(A) ERα, ERβ and GPER mRNA expression in WKY and SHR left ventricular tissue, as evaluated by Real Time PCR and normalization to 18S expression, PCR amplification in absence of cDNA was used as a control (-). Bars represent the mean±SD of 5 experiments for each group. (○) p<0.05 for the expression in SHR vs WKY. (B) ERα, (C) ERβ and (D) GPER protein expression in male WKY and SHR ventricular tissue, lysis buffer without proteins was used as a control (-), protein expressions were normalized to β-tubulin. (E) Densitometric analysis of the blots. Percentage changes were evaluated as mean±SD of 5 experiments for each group. (○) p<0.05 for the expression in SHR vs WKY.

