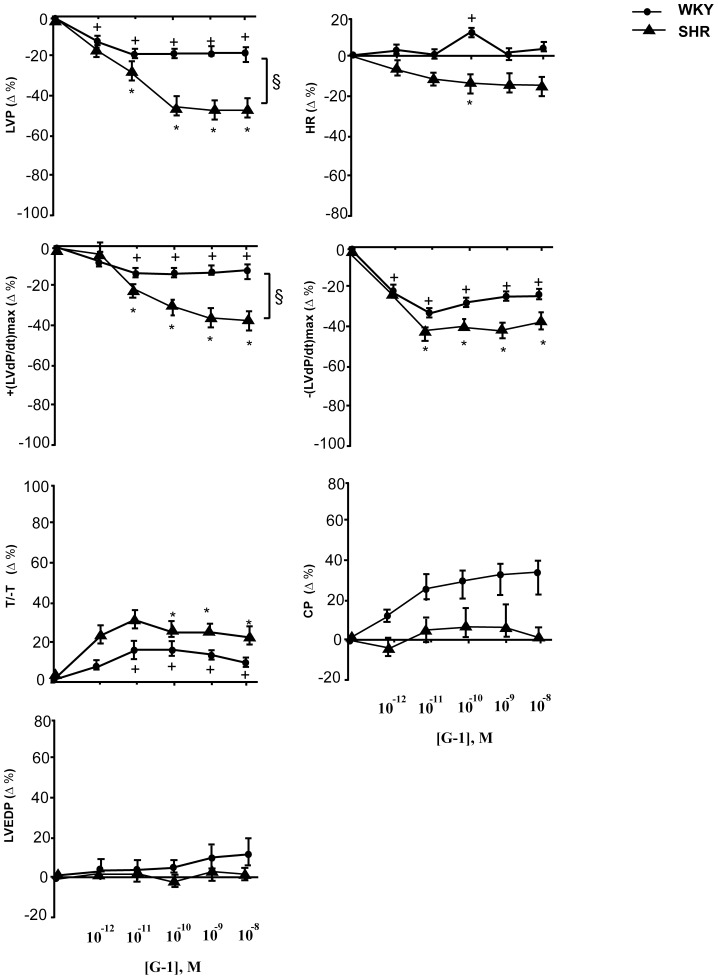
Figure 2. Negative inotropic and lusitropic effects induced by G-1.
Dose-dependent response curves to G-1 (1 pmol/L÷10 nmol/L) on inotropic parameters: LVP and +(LVdP/dT)max, on lusitropic parameters: −(LVdP/dT)max, T/-t, CP and on LVEDP on Langendorff perfused male rat WKY and SHR heart preparations. For abbreviations and basal values see results. Percentage changes were evaluated as mean ± SD of 5 experiments. Significance of difference from control values (One way ANOVA); (*),(+) p<0.05; comparison between groups (ANOVA, Bonferroni's Multiple Comparison Test): (§) p<0.05. For abbreviations and basal values see results.

