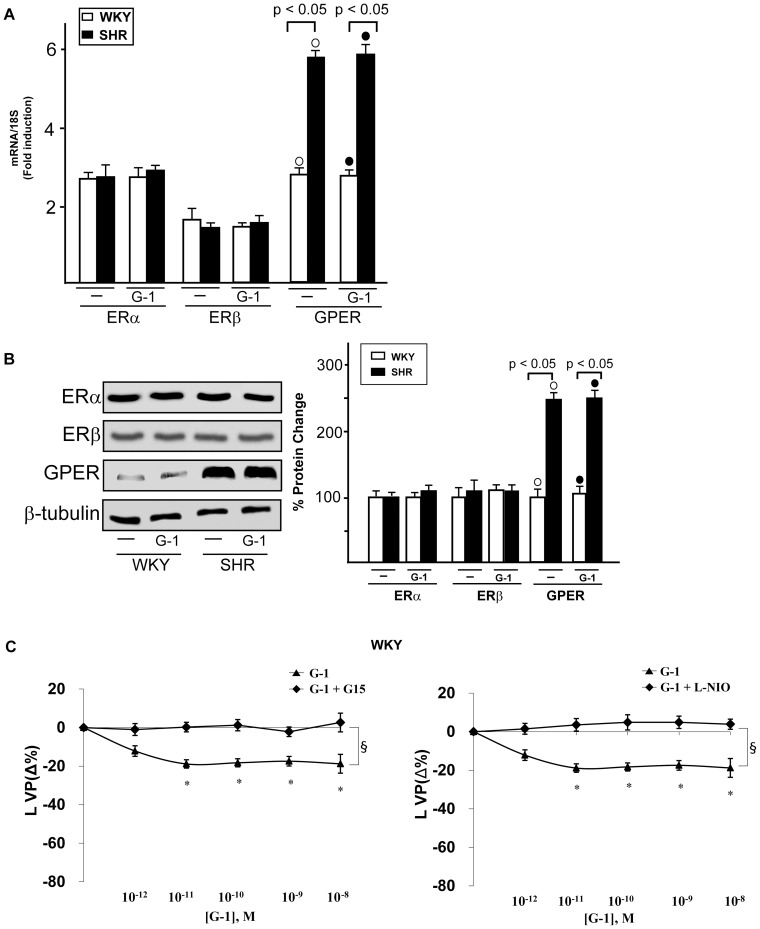
Figure 3. Involvement of eNOS in the cardiotropic actions induced by G-1.
(A) ERα, ERβ and GPER mRNA expression in WKY and SHR left ventricular tissue perfused with vehicle (-) and 1 nmol/L G-1, as evaluated by Real Time PCR and normalization to 18S expression. Bars represent the mean±SD of 5 experiments for each group. (○), (•) p<0.05. (B) ERα, ERβ and GPER protein expression in male WKY and SHR left ventricular tissue perfused with vehicle (-) and 1 nmol/L G-1. Protein expressions were normalized to β-tubulin, percentage changes were evaluated as mean±SD of 5 experiments for each group. (○), (•) p<0.05. (C) LVP responses of isolated and perfused Langendorff rat heart preparations to G-1 alone (1 pmol/L÷10 nmol/L) and in combination with G15 (100 nmol/L) or L-NIO (10 µMol/L). Percentage changes were evaluated as mean±SD of 5 experiments for each group. Significance of difference from control values (One way ANOVA); (*) p<0.05; comparison between groups (ANOVA, Bonferroni's Multiple Comparison Test): (§) p<0.05.

