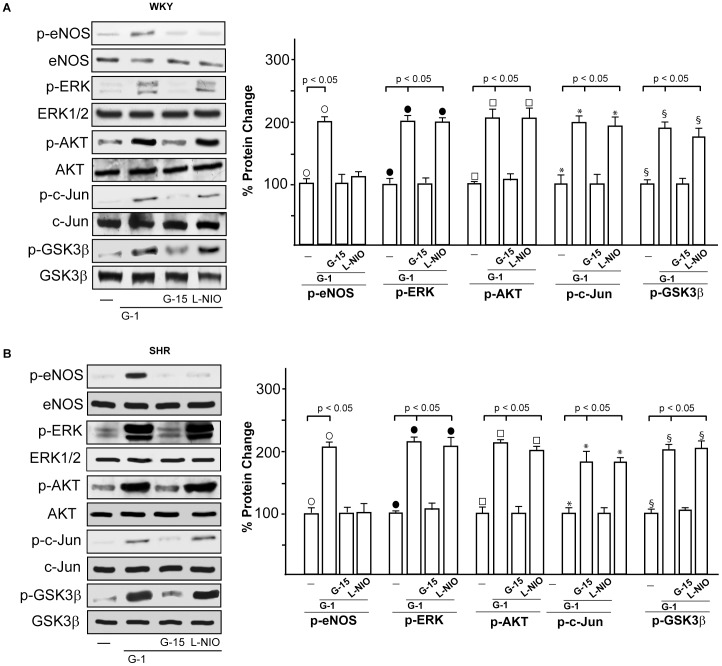
Figure 4. Activation of GPER-mediated signaling.
(A) eNOS, ERK, AKT, c-Jun, and GSK3β phosphorylation in WKY left ventricular tissues perfused with vehicle (-), 1 nmol/L G-1 alone (2 h) and in combination with 100 nmol/L G15 (1 h) or 10 µmol/L L-NIO (1 h). The expression level of each phospho-protein was quantified by densitometry and normalized to the respective total protein content. Percentage changes were evaluated as the mean±SD of 5 experiments for each group. (○), (•), (□), (*), (§) p<0.05. (B) eNOS, ERK, AKT, c-Jun and GSK3β phosphorylation in SHR left ventricular tissues perfused with vehicle (-), 1 nmol/L G-1 alone (2 h) and in combination with 100 nmol/L G15 (1 h) or 10 µmol/L L-NIO (1 h). The expression level of each phospho-protein was quantified by densitometry and normalized to the respective total protein content. Percentage changes were evaluated as the mean±SD of 5 experiments for each group. (○), (•), (□), (*), (§) p<0.05.

