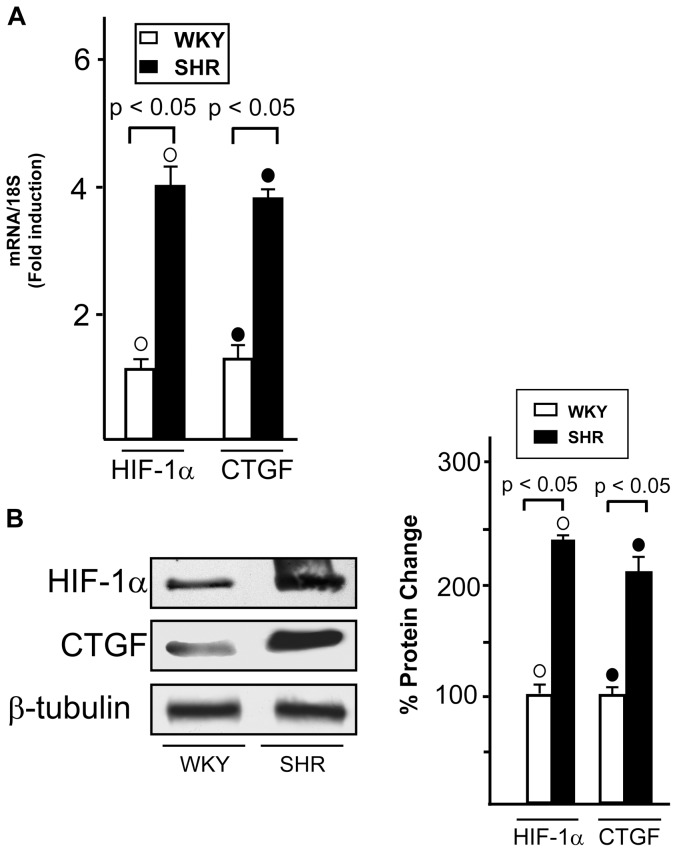
Figure 5. HIF-1α and CTGF expression in normotensive and hypertensive rat hearts.
(A) Evaluation of HIF-1α and CTGF mRNA expression in WKY and SHR left ventricular tissue, as evaluated by Real Time PCR and normalization to 18S expression. Bars represent the mean±SD of 5 experiments for each group. (○), (•) p<0.05 for the expression in SHR vs WKY. (B) Evaluation of HIF-1α and CTGF protein expression in WKY and SHR ventricular tissue, protein expressions were normalized to β-tubulin. Percentage changes were evaluated as mean±SD of 5 experiments for each group. (○), (•) p<0.05 for the expression in SHR vs WKY.

