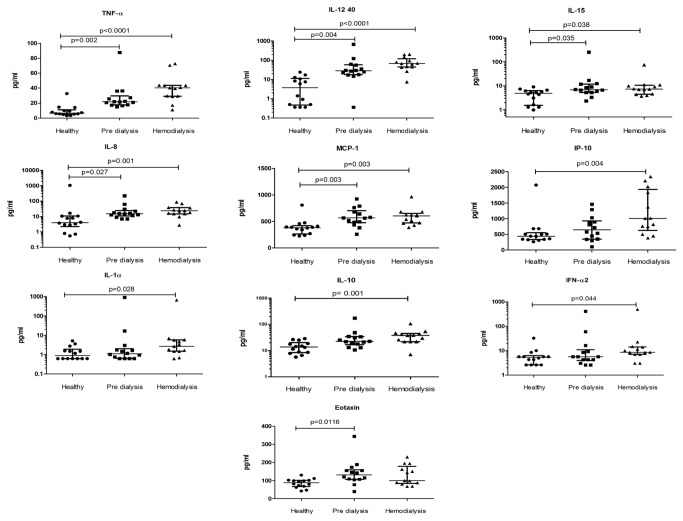
Figure 2. Scatter plots showing cytokines with significantly different plasma concentrations (pg/ml).
The concentration of soluble immune modulators in the plasma of healthy controls, pre-dialysis patients and hemodialysis patients were analyzed and compared. Whiskers represent 25-75% interquartile range with the median shown by a line. Kruskal-Wallis test was used for comparison between the three groups. Significant differences between groups were analyzed using the post hoc Multiple Comparisons p values (2-tailed) test. p<0.05 was considered significant.

