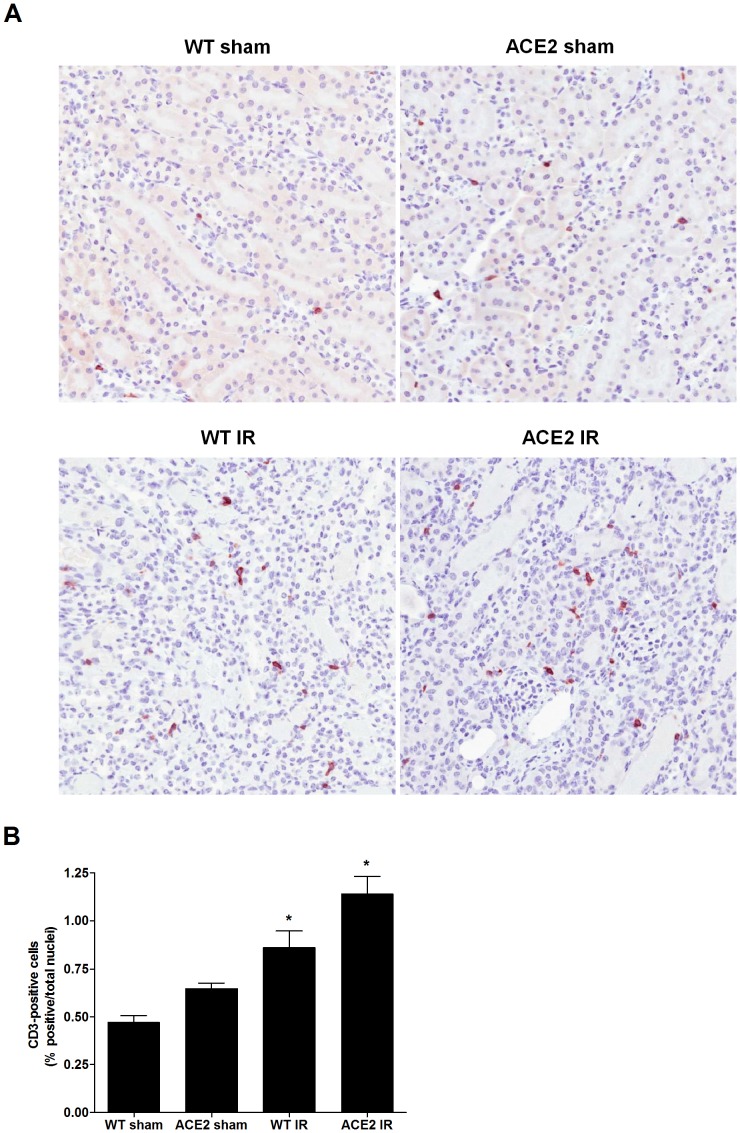
Figure 4. T cell (CD3 positive cell) infiltration following I/R.
(A) Representative images of CD3 staining of kidney sections from WT sham, ACE2 sham, WT IR and ACE2 IR mice; magnification: 200x. (B) Quantitation of T cell infiltration using ImageScope Nuclear algorithm. Results are presented as mean ± SE. n = 8 for WT sham and ACE2 sham; n = 9 for WT IR; n = 11 for ACE2 IR. * p<0.05 vs. WT sham.

