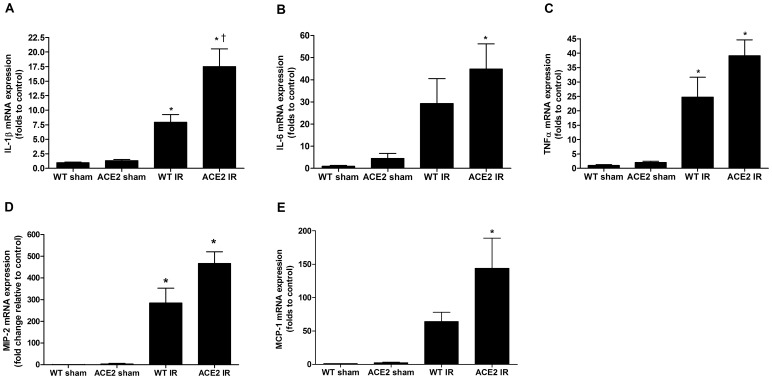
Figure 5. Pro-inflammatory cytokine and chemokine levels after I/R.
mRNA expression levels of IL-1β (A), IL-6 (B), TNFα (C), MIP-2 (D) and MCP-1 (E), in WT and ACE2 KO mouse kidney after sham or I/R surgery. 18s was used as internal control. Results are normalized to WT sham and presented as mean ± SE. n = 5 for WT sham; n = 6 for ACE2 sham; n = 6 for WT IR; n = 5 for ACE2 IR. * p<0.05 vs. WT sham. † p<0.05 vs. WT IR.

