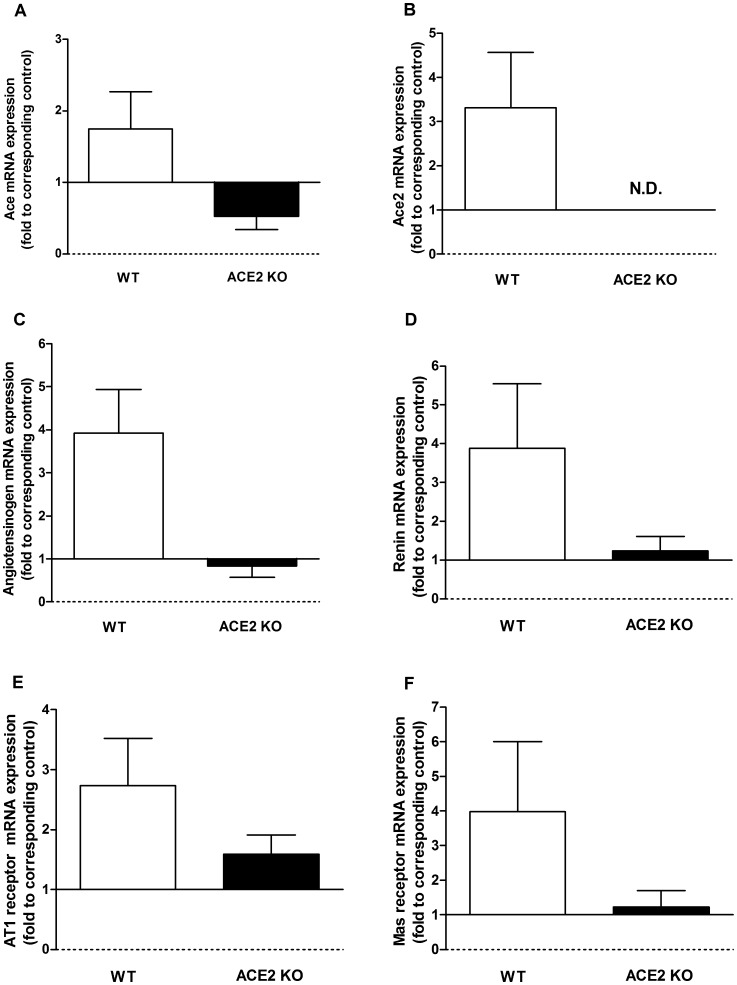
Figure 12. Changes in expression levels of RAS components after renal I/R.
Expression of ace (A), ace2 (B), angiotensinogen (C), renin (D), agtr1 (angtiotensin II receptor, type I,) (E), and mas (F) after I/R were compared to corresponding control sham animals in WT and ACE2 KO groups. mRNA levels were determined by real-time PCR and 18s used as internal control. Results are presented as mean ± SE. n = 6 in WT group; n = 4 in ACE2 group.

