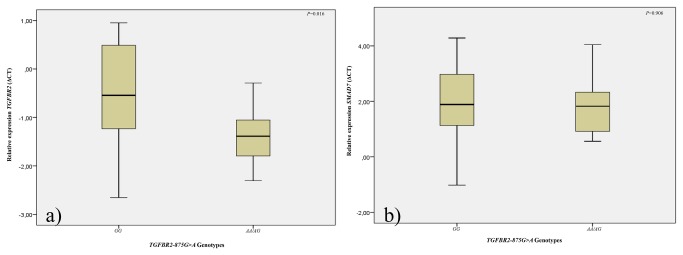
Figure 2. Normalized expression among individuals with TGFBR2-875GG vs TGFBR2-875AA/AG genotypes regarding a) TGFBR2 mRNA and b) SMAD7 mRNA.

Statistical differences in the TGFBR2 and SMAD7 mRNA levels were evaluated by the Student’s t-Test.

Statistical differences in the TGFBR2 and SMAD7 mRNA levels were evaluated by the Student’s t-Test.