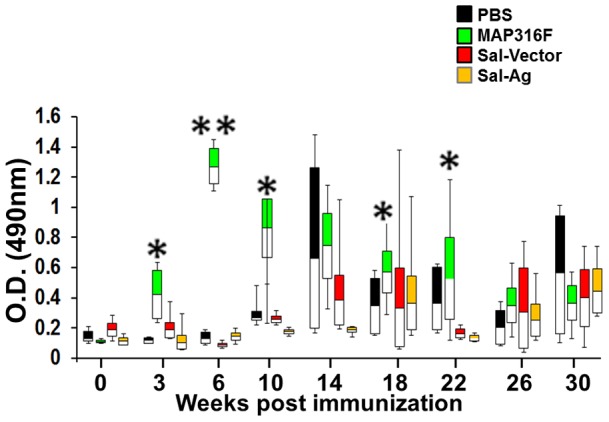
Figure 1. Antibody response.

Blood collected at various time points was allowed to clot and serum collected was analyzed for total IgG against Ags (85A, 85B, SOD) or jhonin PPD at serum dilution of 1:200 using indirect ELISA as described in material and methods. The response is measured in individual goats and data is represented in the form of whisker-box plots (PBS Vs 316F * indicates p<0.05 ** indicates p<0.01).
