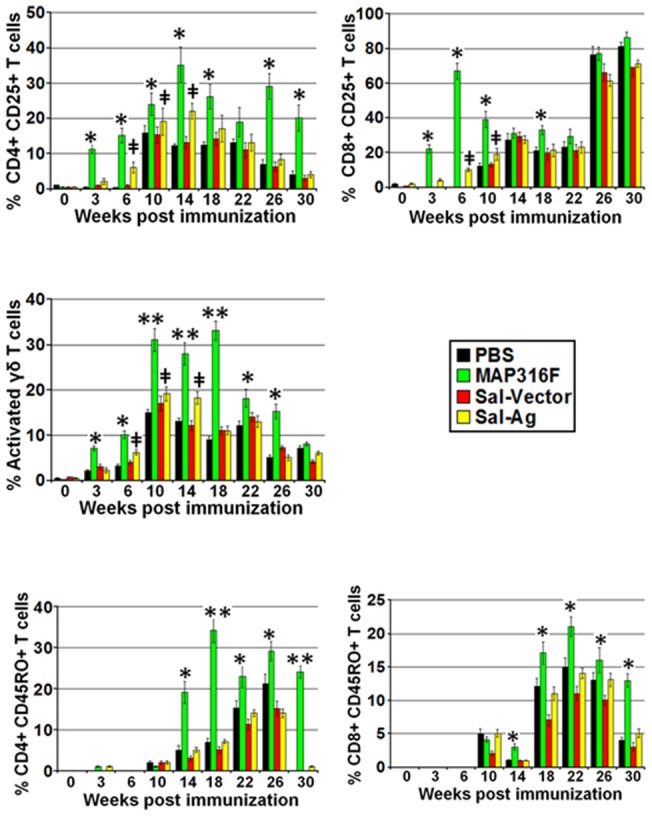
Figure 4. T cell analysis.

Comparison of activation and memory status of T cells in PBMCs isolated from animals bled at various time points after immunization, simulated with/without Ag-mix (15 μg/ml) or PPDj (10 µg/ml) for 6 days and subjected to FACS analysis. The data was analyzed by BD FACS Diva software. The data is presented in bar graph form for simplicity. Analysis of activation status (CD25 expression) of (A) CD4 T, (B) CD8 T and (C) γδ T cells at various time points. Analysis of Effector memory phenotype (CD45RO expression) of (D) CD4 and (E) CD8 T cells at various time points. (PBS Vs 316F *indicates p<0.05** indicates p<0.01, PBS Vs Sal-Ag ‡ indicates p<0.05 ‡‡ indicates p<0.01).
