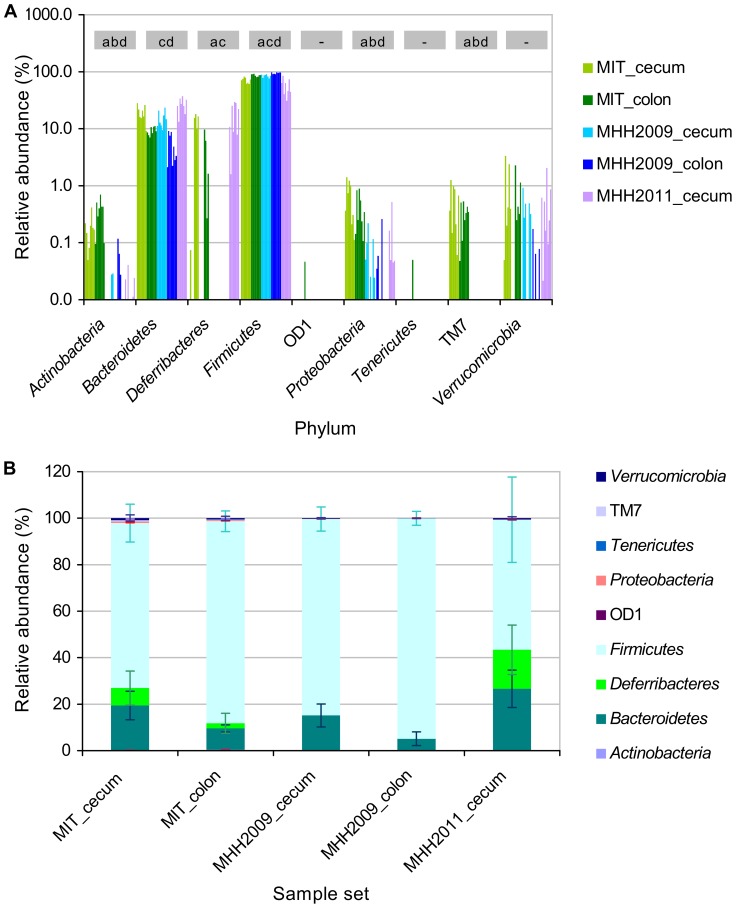
Figure 5. Phylum-level composition of microbiota.
A. Fraction of sequence counts in each of the individual samples, color coded by sample group. Grey boxes indicate significant differences between sample groups (unequal variances t-Test, p<0.05): a, significantly different between MIT and MHH2009 cecum samples; b, significantly different between MIT and MHH2011 cecum samples; c, significantly different between MHH2009 and MHH2011 cecum samples; d, significantly different between MIT and MHH2009 colon samples. B. Relative abundance of phyla in each of the sample groups, including standard deviation (n = 8).

