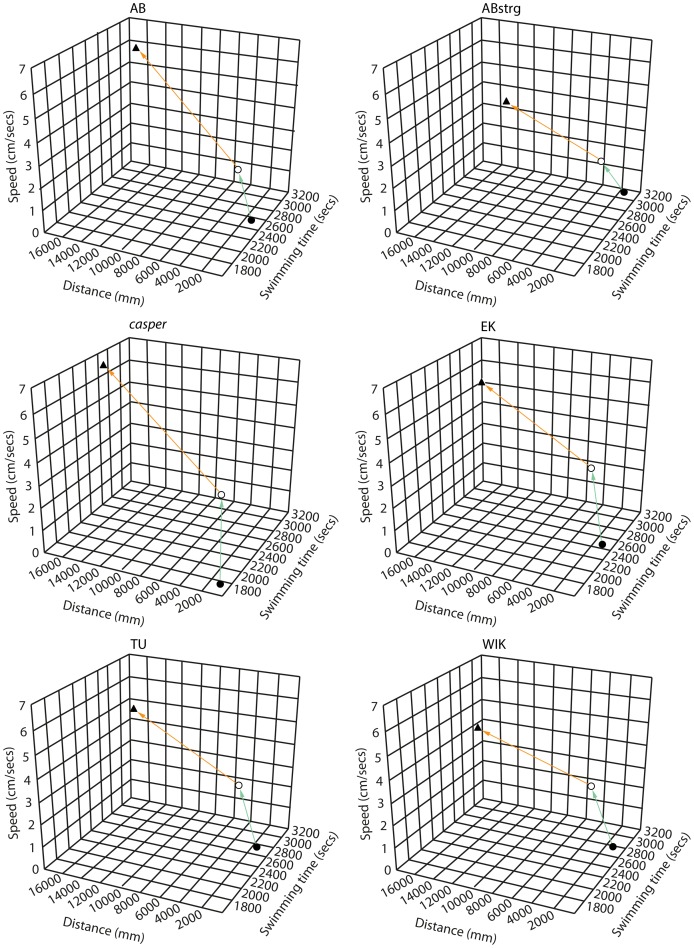
Figure 4. The ontogeny of zebrafish locomotion.
Graph showing a summary of behavioural ontogeny in 6 zebrafish strains. The black circles represent mean data points for 6 day-old larvae, clear circles for 1 month-old- and black triangles for 3 month-old fish. The arrows indicate the increase in distance, speed and time throughout the experiment.

