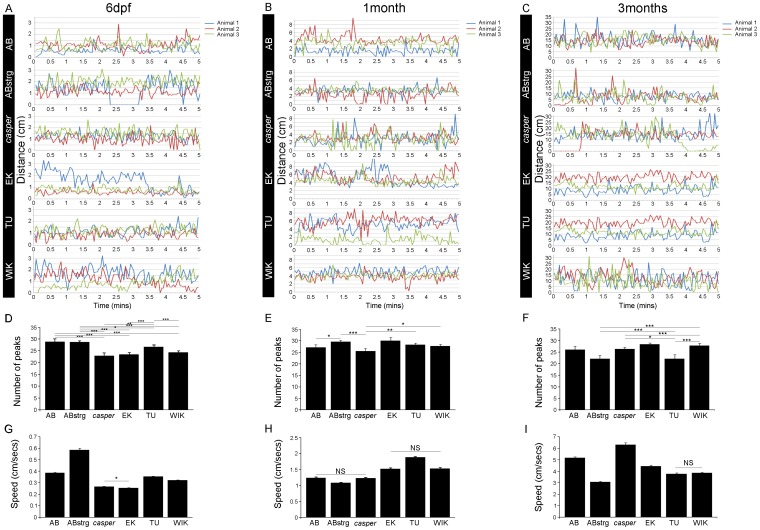
Figure 5. Fast swim event curves for 6 zebrafish strains at different life stages.
A,B,C) Representative curves showing fast swim events in three individual fish at 6 dpf (A), 1 month (B) and 3 months (C). Strains are indicated on black bars to the left. D) Number of peaks of fast swimming during a 5-minute experiment. Peaks were defined as acceleration events when the larvae travelled more than 5 mm in less than 12 seconds. At 6 dpf, casper, EK, TU and WIK show fewer peaks of fast swimming than AB and ABstrg. For the statistics refer to table 3. E) Number of peaks of fast swimming during a 5-minute experiment. Peaks were defined as acceleration events when the juveniles travelled more than 5 mm in less than 12 seconds. At 1 month ABstrg, EK, TU and WIK show more peaks of fast swimming than AB and casper. For the statistics refer to table 3. F) Number of peaks of fast swimming during a 5-minute experiment. Peaks were defined as acceleration events when the fish travelled more than 5 mm in less than 12 seconds. At 3 months ABstrg and TU showed significantly fewer peaks of fast swimming than AB, casper, EK and WIK. There were, however, differences between the other strains (see results). For the statistics refer to table 3. G) Mean distance swum in a 5-minute time interval by 6 day-old AB, ABstrg, casper, EK, TU and WIK larvae. ABstrg swam significantly further, and casper, EK, TU and WIK significantly less than AB. For the statistics refer to table 3. H) Mean distance swum in a 5-minute time interval by 1 month-old AB, ABstrg, casper, EK, TU and WIK juveniles. ABstrg swam significantly less, and EK, TU and WIK significantly further than AB and casper. For the statistics refer to table 3. I) Mean distance swum in a 5-minute time interval by 3 month-old AB, ABstrg, casper, EK, TU and WIK adults. ABstrg, EK, TU and WIK swam significantly less, and casper significantly further than AB. For the statistics refer to table 2.

