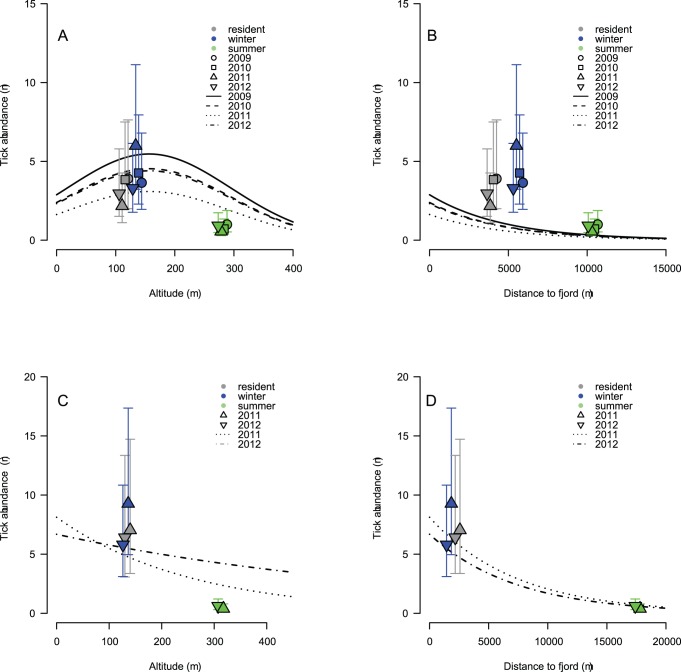
Figure 2. Tick abundance as a function of (A, C) altitude in meters above sea level and (B, D) distance to fjord measured in meters in (A, B) Sogn & Fjordane and (C, D) Møre & Romsdal counties, Norway.
The symbols are estimates of the three home range categories (±1.96*SE) plotted against mean altitude and distance to fjord within the category. Gray symbols represent home ranges of resident red deer, blue and green symbols represents winter and summer home ranges, respectively, for migratory red deer. The home ranges are identical between years, but we have shifted the home range symbols slightly between years for visibility in the figure. Note that lines and point estimates come from different models and therefore do not match entirely due to other factors included (altitude, inclination and distance to fjord).

