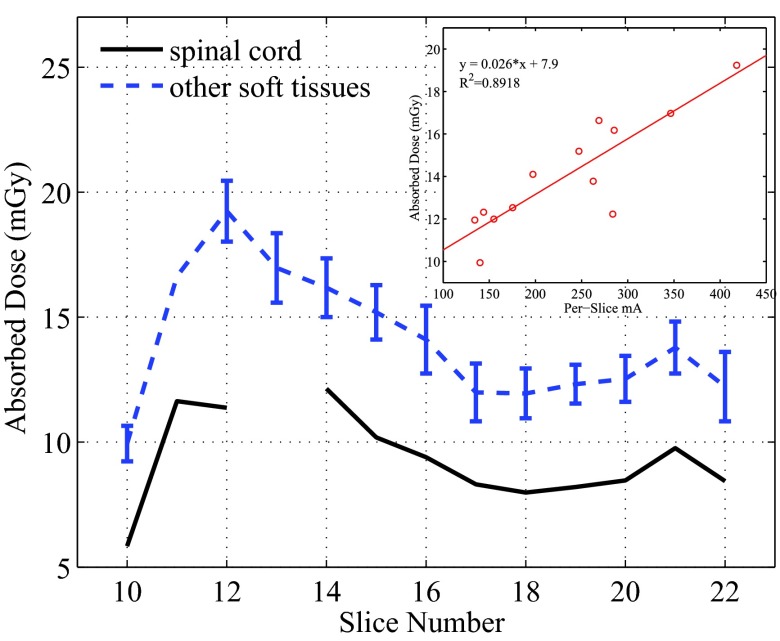
Figure 10.
Per slice dose in the spinal cord and all other soft tissues. For the soft tissues, the averaged doses were plotted with error bars which represent 1 standard deviation. The relationship between these averaged doses and the averaged tube current was plotted for Slices 10–21 in the small figure.

