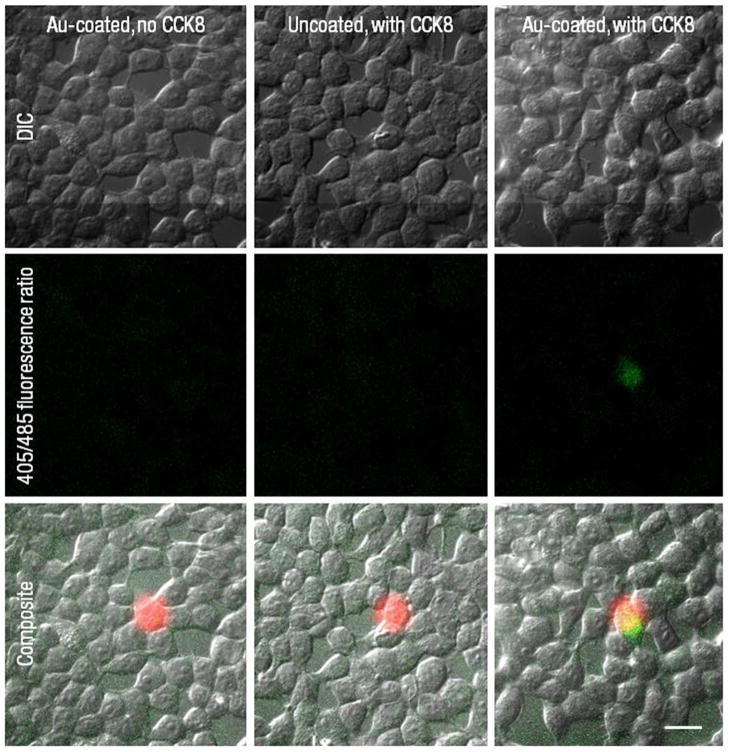
Figure 3.
Differential interference contrast images of HEK293/CCK2R cells (top row), 405/485 ratiometric images derived from fluorescence imaging of Indo-1 (middle row), and composite images of DIC, ratiometric, and 760 nm laser spot images (bottom row). Ratiometric images represent intracellular calcium concentration after 1.5 minutes of illumination; green color is indicative of increases in intracellular calcium levels from baseline ratios around 0.43; quantitative representation of intracellular calcium is presented in Figure 4. Cells incubated with gold-coated liposomes (right column) demonstrate an increase in calcium response due to CCK2 receptor activation in the cell co-localized with the laser spot (shown in red), as evident by the overlapping green and red color (bottom row). Cells incubated with gold-coated blank liposomes (left column) and uncoated CCK8-loaded liposomes (middle column) do not demonstrate significant change in calcium response due to laser illumination (middle and bottom rows). Scale bar applies to all panels and corresponds to 20 μm.

