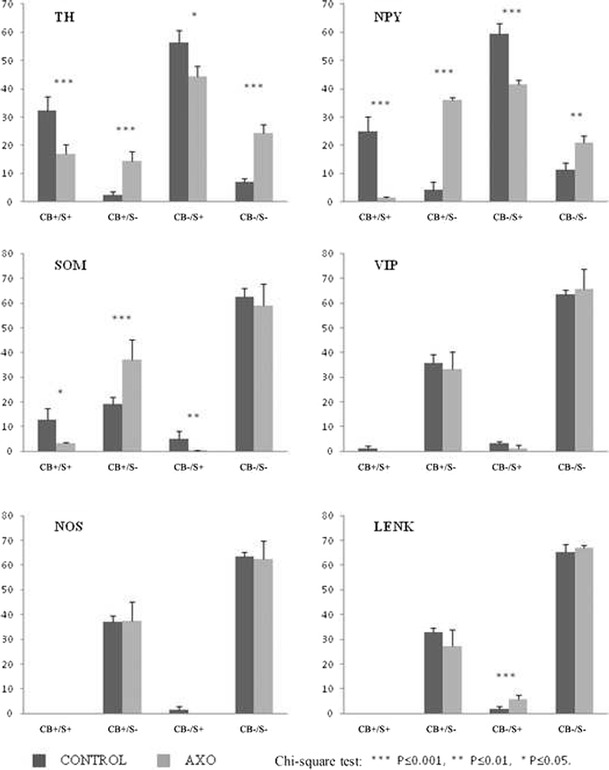
Fig. 1.

Diagram illustrating the FB+ cell numbers which were immunoreactive to appropriate antigens in IMGs of control animals (dark gray bars) and animals with bilateral axotomy of caudal colonic nerves (light gray bars; in percent). Chi-square tests, *P ≤ 0.05, **P ≤ 0.01, ***P ≤ 0.001
