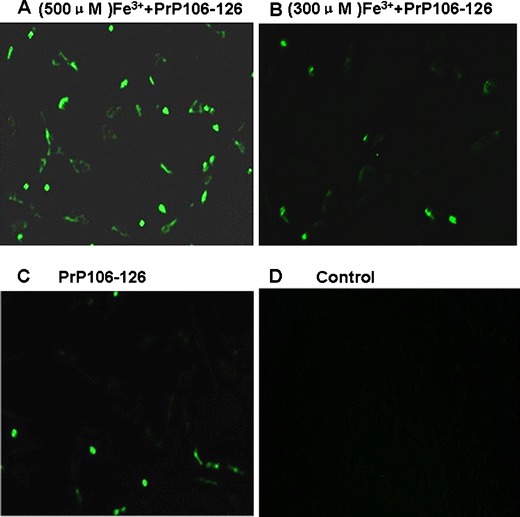
Fig. 2.

The treated cells were used for measuring ROS release with the DCFH-DA assay, as described in Section “DCFH-DA Assay and Visual Detection.” N2a cells were cultured on cover slips in a 12-well plate for 12 h, then treated with Fe3+ (final concentrations 500 μM) and PrP106–126 (final concentration 50 μM) for 12. a The fluorescence intensity had increased significantly (500 μM Fe3+ + PrP106–126). b Some fluorescence had emerged (300 μM Fe3+ + PrP106–126). c Some fluorescence had emerged (PrP106–126 only). d There is no fluorescence (control)
