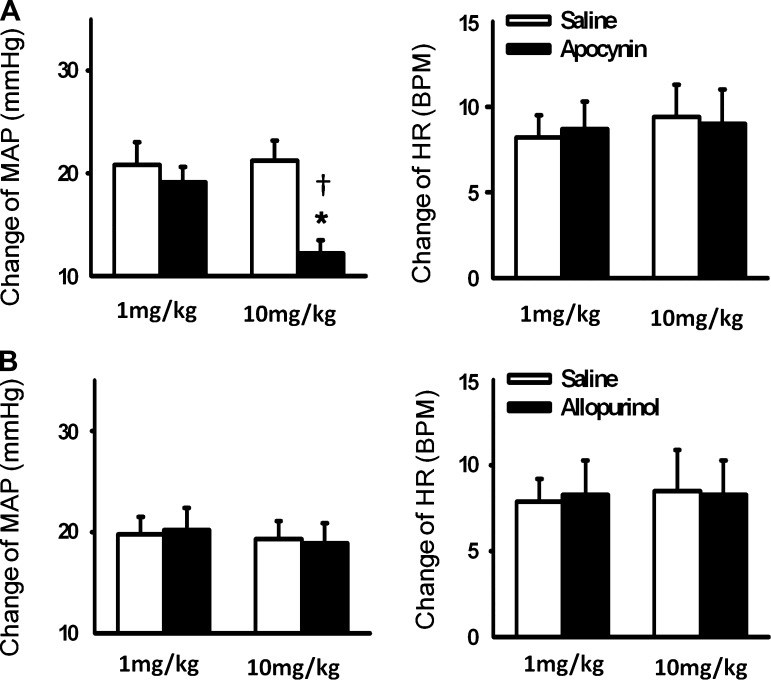
Fig. 6.
Mean changes in MAP and HR in response to a 30-s static contraction before and after hindlimb arterial infusion of apocynin (A) and allopurinol (B). Saline was infused as the control. Values are means ± SE; n = 6 in each group. *P < 0.05 vs. saline; †P < 0.05 vs. the lowest dose group (1 mg/kg).

