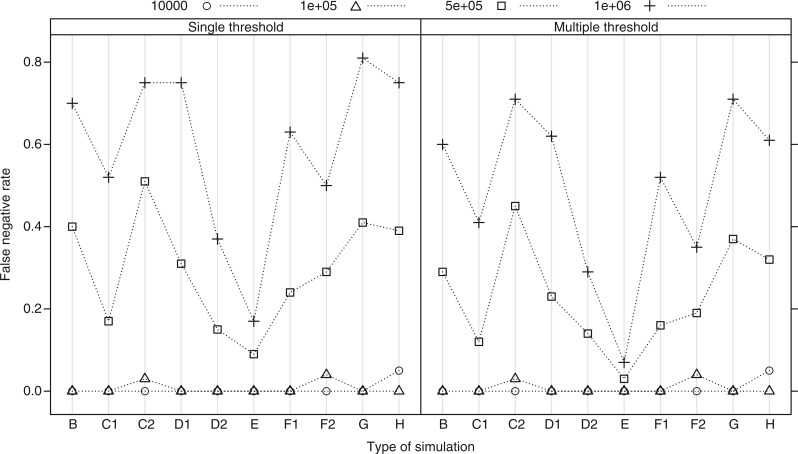
Figure 2.
The mean false negative rate for each type of simulation and each effective population size from a sample of 100 simulated trees for each simulation type and population size combination. Simulation types are described in the ‘Methods' section: B is the constant speciation rate scenario; C1 is the incomplete sampling of species scenario; C2 is the constant background extinction rate scenario; D1 is growing populations; D2 is declining populations; E is variable population sizes among species; F1 is random sampling across the clade, equal population sizes; F2 is random sampling across the clade, unequal population sizes; G is with geographical structure within species; H is from inferred trees from simulated sequence data.

