
Figure 7.
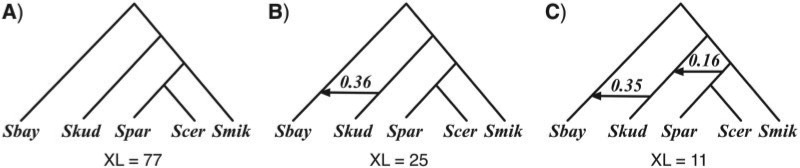
Analysis of the yeast data set, where gene trees are reconstructed using MP. Optimal species phylogenies, along with inheritance probabilities, inferred from gene trees reconstructed by maximum parsimony for the yeast data set of (Rokas et al. 2003). A) The optimal species tree (network with 0 reticulation nodes). B) The optimal species network containing one reticulation node. C) The optimal species network containing two reticulation nodes. For each species phylogeny, the total number of extra lineages (XL) is computed using Equation (2) and reported.